
Ultipa has been serving some of world’s largest, most demanding and sophisticated retail and commercial banks. Ultipa’s graph products have been adopted by and deployed in BFSI and other commercial-grade industries which are known for their voracious demands for high concurrency and low latency. Ultipa team has developed turn-key killer apps that encompassing the following scenarios:
- Smart BI/Analytics (Next-gen BI, Advanced Analytics, etc.)
- Industrial Internet (IoT)
- Supply Chain Finance (Distributed Blockchain Database, etc.)
- Asset-Liability Management (Treasury Management, Capital Management)
- Liquidity Management (Liquidity Risk Management, Real-time LCR w/ Attribution Analysis and Simulation, Intra-day Liquidity Management)
- Risk Management (Credit Risk, Market Risk, Liquidity Risk, etc.)
- Smart Data Toolkits (Data Governance, RDA, MDM, Enterprise GRC, etc.)
- Real-time Knowledge Graph
- Real-time Explainable Al (XAI)
- Business Research Graph | Real-time Decision Making
- Anti-Fraud (Real-time Fraud Detection, Decision Making, etc.)
- Smart Marketing (Credit Card Spend Prediction, Smart Recommendation, etc.)
- Money-flow Tracing and Anti-Money Laundering
- Meta-Data Management
- Email Forensic
- Multimodal Data Fusion
- Neuromorphic Computing
- High-dimensional Search & Recommendation Engine
- Chatbot/NLP
We selected 3 use cases to illustrate how Ultipa can empower enterprise w/ graph augmented intelligence and XAI, and with lower TCO, lower TTV and higher ROI.
Real-Time Decision-Making System (Anti-Fraud & RTD)
Every year enterprises and governments are losing hundreds of billions of dollars due to fraud. As more and more transactions are conducted over the internet, online fraud detection, anti-money laundering and decision makings have become a necessity. Traditional RDBMS or Big-data-n-AI based fraud-detection or decision-making systems are not capable of online real-time fraud detection or decision making.
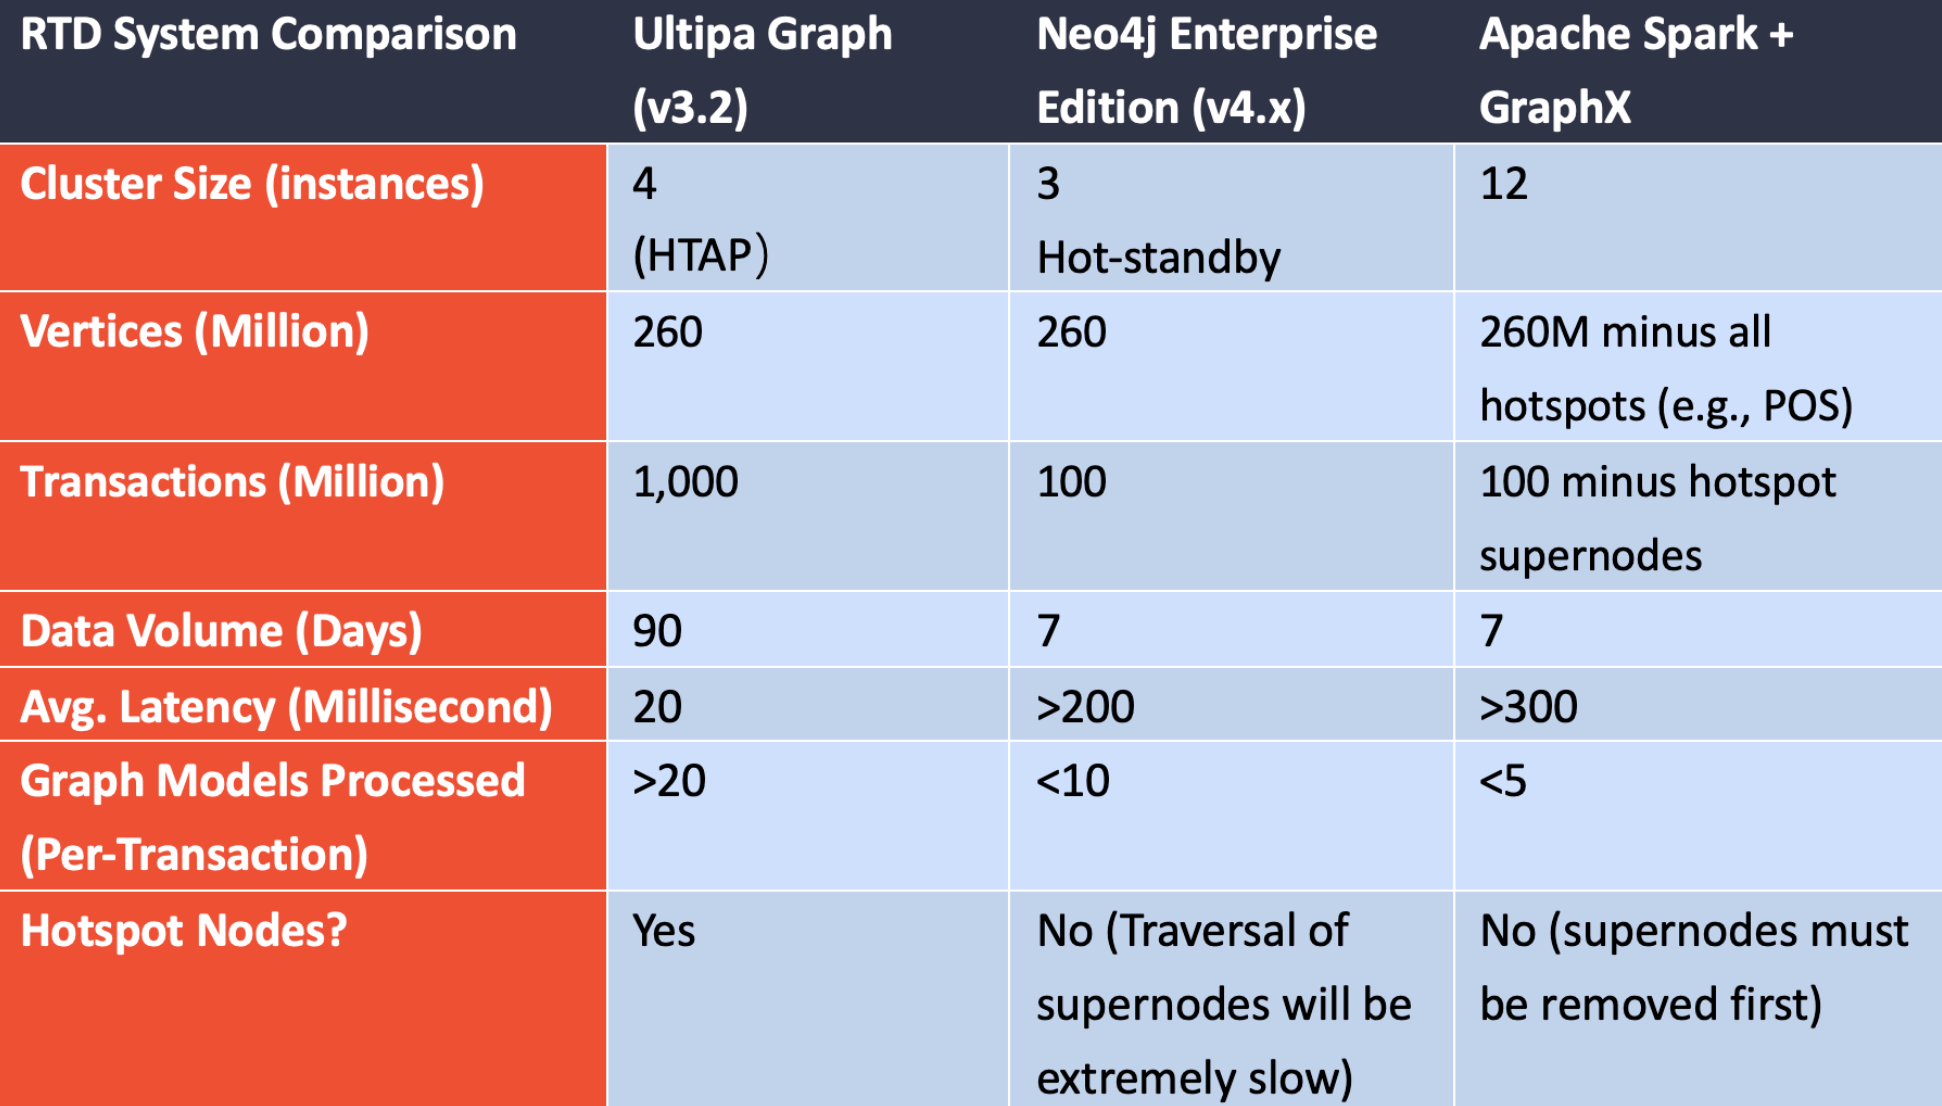
A leading joint-stock retail & commercial bank has been exploring ways to identify fraudulent risks associated with their debit cards, they have issued 200 million cards, and on daily basis these cards conduct tens of millions of transactions involving 300 million cards (including millions of cards or merchant POS accounts issued by other financial institutes). Their legacy transaction anti-fraud systems have gone through several generations of evolvement built on top of In-memory relational database and Apache Spark GraphX framework, which share 3 common and major drawbacks:
-
Latency is Too High: The average latency for transaction fraud detection is over 300ms, and the highly concurrent nature of online transactions cause traffic to pile up and wait forever for a decision to be made. Online fraud detection must be real-time, every extra second taken to respond means degraded user experience and friction for trusted users.
-
Can’t Handle Hotspots (Supernodes): Some transactional counterparties are having tens of thousands of transactions a day, these counterparties are considered supernodes and their associated transactions have to be removed in the Spark system to allow for faster transactional behavior analysis (in-memory RDBMS system will slow down to non-performing), therefore causing the transaction network incomplete (and decision made potentially inaccurate).
-
No Real-Time ETL is Supported (especially for Spark): Spark can only process static data after it’s ETLed, but transactions keep on flowing in. Even though some vendors have claimed to use Spark as real-time data warehouse, it’s simply not.
The bank understands that they need a graph database to deal with the real-time fraud detections of card transactions. They played with Neo4j Enterprise Edition and realized that though it’s faster than Spark by 30-50%, it still can’t handle supernodes and can’t match their expectation of 30 ms latency for each transaction analysis (Yes, Neo4j tends to slow down dramatically when dealing with supernodes, and every morning, Neo4j can queue up millions of transactions un-processed in the backlog, essentially making the anti-fraud system useless).
Ultipa Graph helps the bank’s IT department setup a 4-instance cluster in hours (with 1-click fast deployment) and developed their in-house graph-based fraud detection solution in weeks by integrating with Ultipa’s Java SDK. The entire solution contains the following features:
- Real-time transaction update (via Ultipa HTAP architecture), note that each incoming transaction changes the graph dataset and its topology, with new vertices and new edges (or updating existing vertices or edges).
- 20+ graph models executed against every transaction to examine the transactional counter-parties networked behavior over a 90-day period.
- Graph dataset contains 90-Day transactional data.
- No hotspot super-node is left behind.
- Total latency is within 20 ms for each transaction’s fraud-detection analysis.
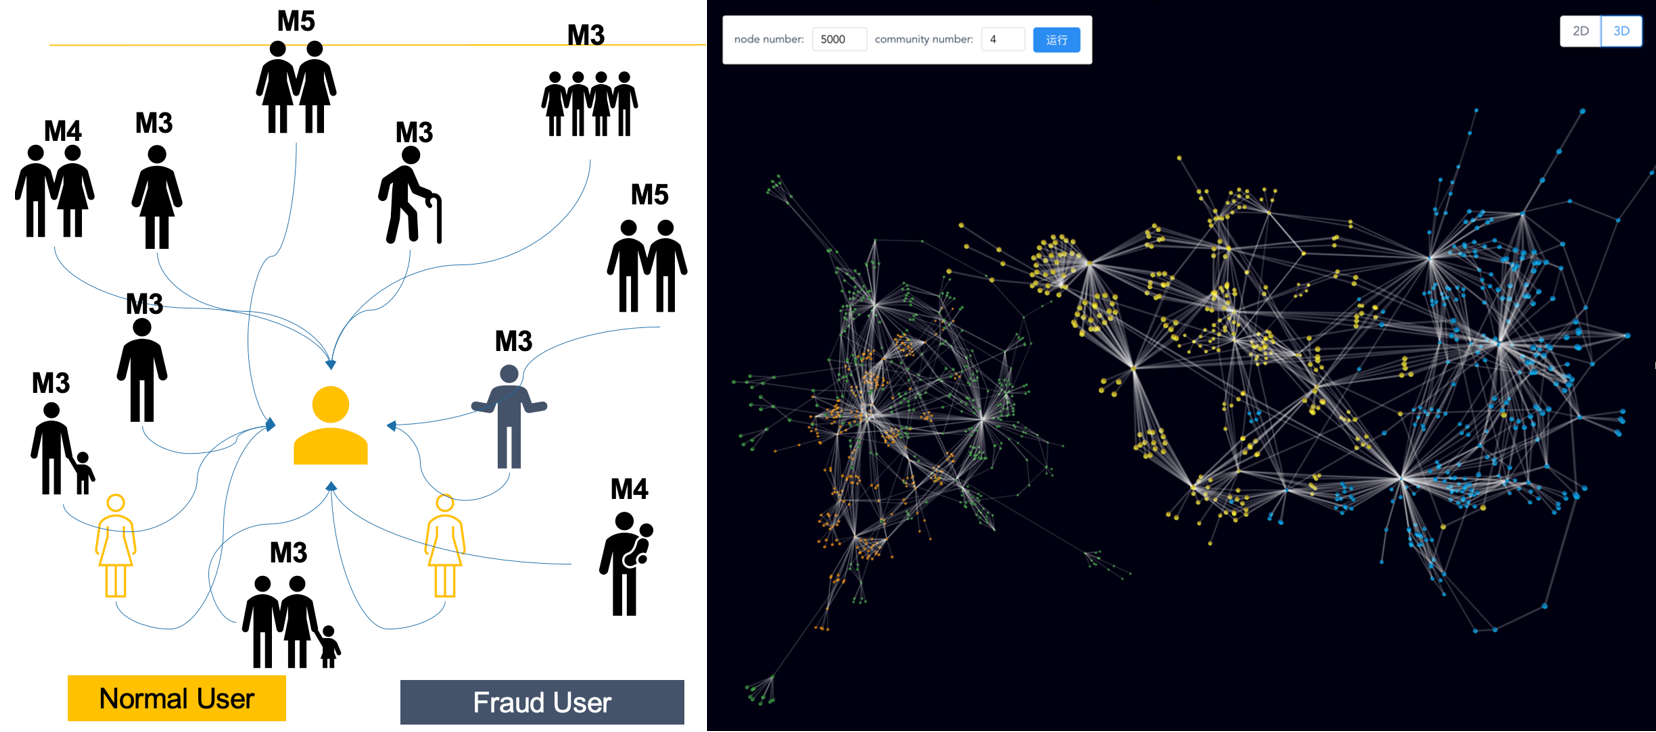
For the first time ever, the bank’s IT department sees a complete card transactional behavior network with all super-nodes included, and no backlog is piled up when tons of transactions are rushing in during peak hours as they would experience otherwise with Spark or Neo4j.
The ROI and performance gain is in the range of 100s to 1,000 of times, if you zoom into each transaction’s decision-making, each model takes only 0.1 millisecond (100 microseconds), that’s the beauty of real-time graph computing, only from Ultipa.
Intraday Liquidity Risk & Cash Management System (LRM)
Ultipa introduces a monitoring tool, analysis engine and reporting platform to help firms to monitor, manage and report liquidity risk. The real-time liquidity results are performed on dashboards to optimize firms’ management practices. The top 3 features of Ultipa LRM include LCR management & reporting, real-time intraday liquidity monitoring & management and cash management and projection.
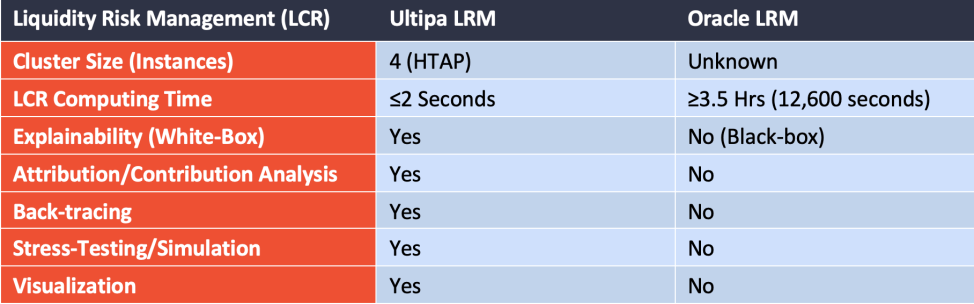
Traditional LCR solutions were built on top of RDBMS such as Oracle DBMS, which has 4 major drawbacks (pain points):
- SLOW: Large commercial and retail banks have tons of daily transactions, computing liquidity indicators like LCR takes long time, usually in T+1 manner, which poses as hurdle for more frequent system health checking, scenario simulation, or stress testing, and defers the decision-making process.
- Black-Box, No Breakdown or Composition Analysis: Traditional RDBMS-based LCR solutions calculate LCR indicator in a black-box fashion without any deep diving capability to explore any factors that offer in-depth understanding of a bank’s flowing liquidity risks and implications to its assets and liability management.
- No Attribution Analysis, No Contribution Analysis: Without the capability of backtracing, banks will NOT know what factors contribute most to the changes of LCR, and what the paths of impact are. Without such information, it would be impossible for banks to gain clarity into their core assets and liabilities therefore affecting profitability.
- No Simulation or Stress Testing: Not being able to simulate in real-time, for instance, how good or bad the situations would go when certain enterprise customers, industries, branches, or bank accounts have situational changes.
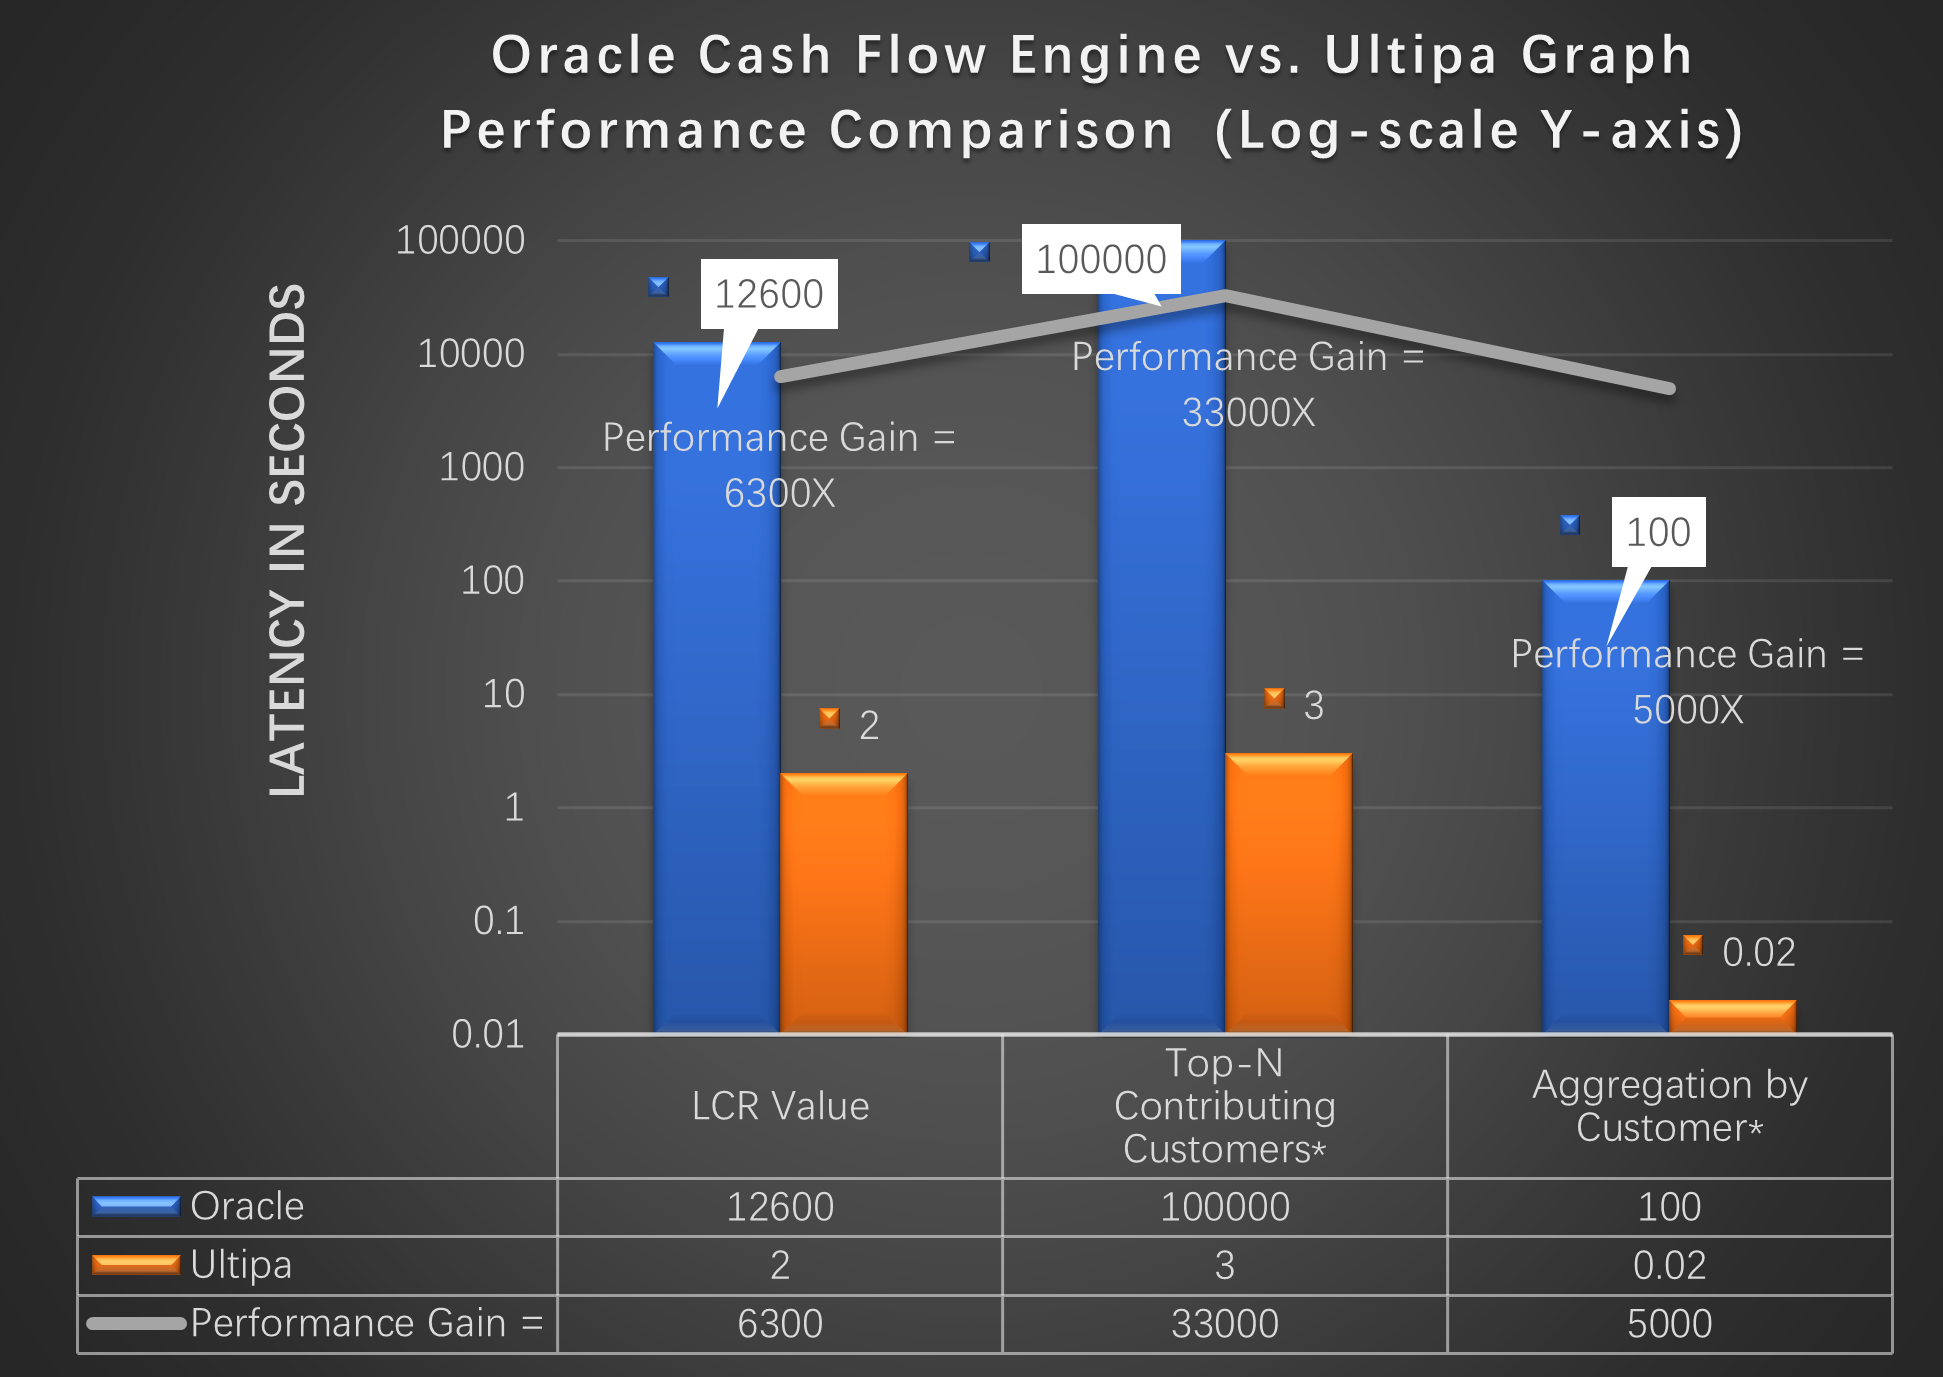
To achieve intraday LCR or even real-time business intelligence with LCR, you have to explore disruptive technologies like real-time graph computing. Ultipa LRM system has successfully helped a leading commercial and retail bank build its liquidity risk management graph system which won the "Achievement in Liquidity Risk Management” award in 2021 by The Asian Banker Award, it’s a worldwide first showcase of using graph technology to explore and manage liquidity risk with unprecedented speed, flexibility, and user-experience.
The below diagram shows that Ultipa Graph DB (the core engine that powers the LRM system) has on average 10,000x performance gain over Oracle’s relational DBMS. In other Asset Liability Management scenarios, similar performance gains are repeatedly achieved.
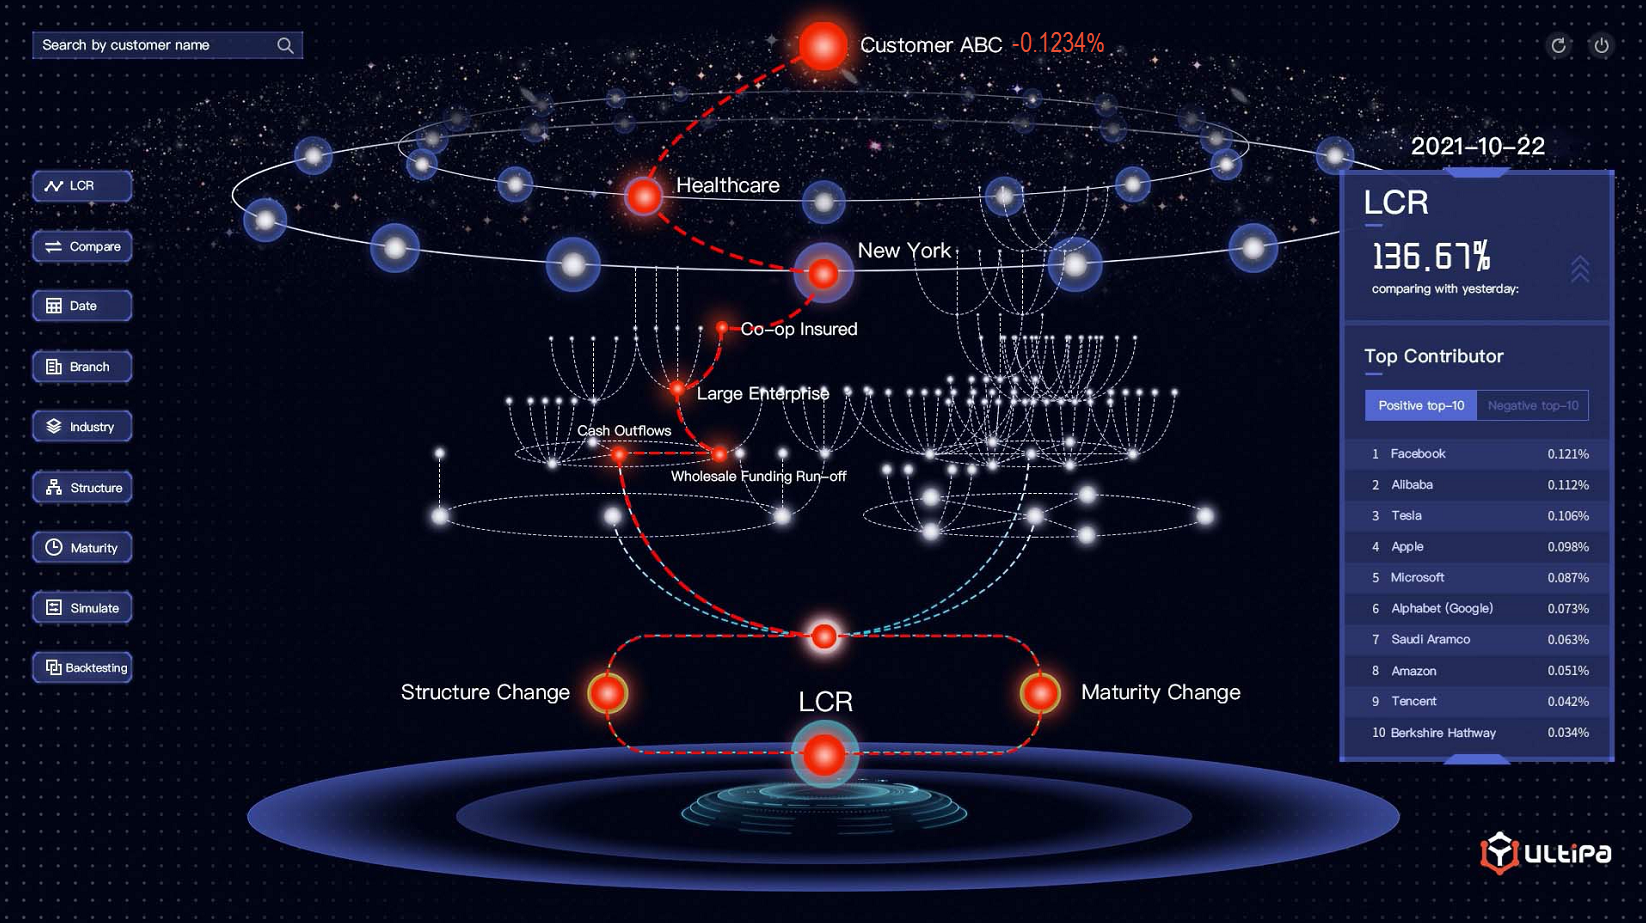
Ultipa LRM allows user to drill down on the composition of daily liquidity indicator, such as LCR, to the finest granularity (per deal, per account, per customer, per segment, per branching center, …).
Graph computing offers great explainability. This is reflected in the way how data are aggregated and drilled down during the graph computing process underpinning any attribution/performance/impact analysis or scenario simulation. The transmitting paths shown on the dashboard visualize everything in an intuitively white-box and highly explainable way.
Unlike traditional SQL based stress testing or scenario simulation process, Ultipa LRM offers real- time simulation, back-testing and stress testing with unlimited number of scenarios (combination of that many factors) made possible with the help of Ultipa Graph DBMS computing power and graph query’s unprecedented flexibility.
Ultipa offers end-to-end LRM solutions by leveraging Ultipa Graph Database’s real-time graph computing power and Ultipa Manager’s 3D visualization and highly interactive and business-friendly dashboard, it’s a true one-of-a-kind killer app for banks to stay on top of their valuable assets and liabilities while satisfying domestic and international regulatory needs without hassles. The screenshot above shows how real-time LCRcontribution analysis is performed on a customer’s account in a highly visualized and interactive 3D dashboard.
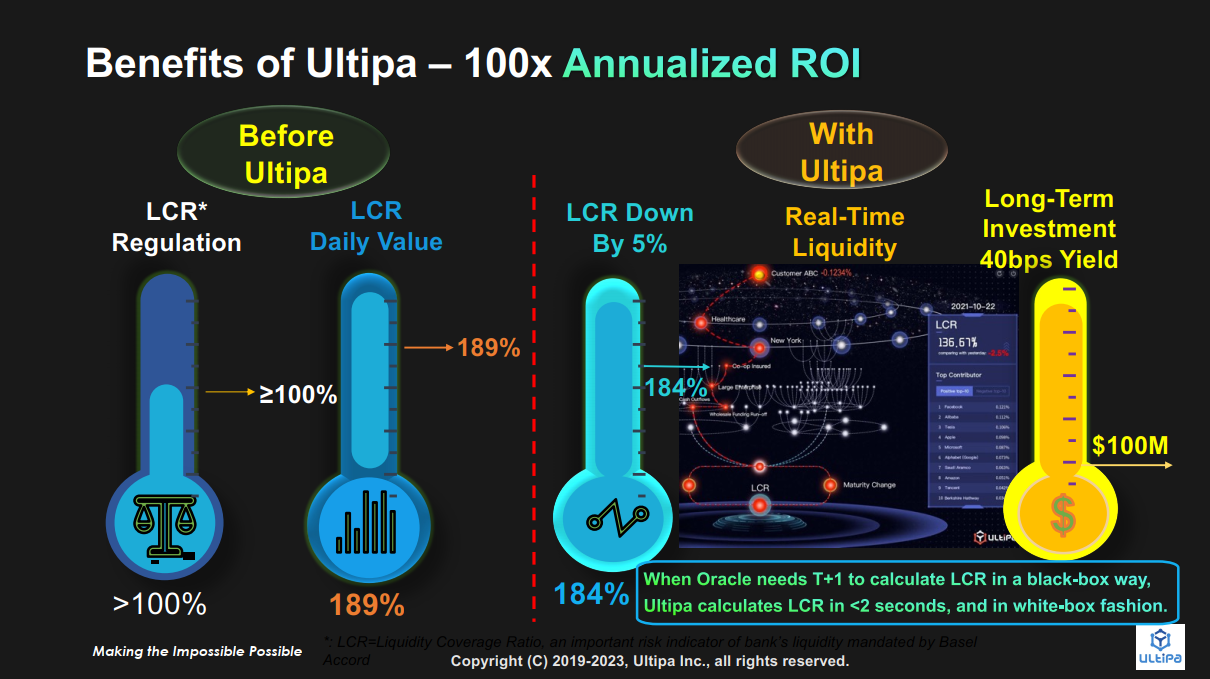
Ultipa LRM empowers modern banks to go real-time with their liquidity risk management and monitoring so that not only to meet regulatory requirements but also to strengthen internal controls, boost productivities and achieve improved profitability (see the above diagram for illustrated benefits). Previous LRM solutions like Oracle are slow, headless, black-box and without much attribution analysis capability, with Ultipa LRM, you get a lightning fast, fully interactive dashboard with white-box explainability and real-time attribution/contribution analysis all by your fingertips with celerity and unprecedented flexibility.
Asset & Liability Management Graph System (ALM)
All tasks and services of a bank make part of Asset and Liability Management (ALM). Every single deal or transaction creates liquidity and risk. These risk positions need to be bundled, made transparent, and the risk quantified and managed. ALM requires the IT department to supply all relevant data in a consistent, complete, and online fashion, and allow back office and customer departments to drill down on any deals to know their contribution (a.k.a. attribution analysis or back-tracing), ideally in real time (online) instead of T+1 or T+N. These requirements have made ALM particularly challenging. Ultipa ALM system addresses such challenges with real-time high- density graph computing and offers superior agility, flexibility, and unprecedented A& L management and monitoring features that help ALM & Treasury department stay on top of their business data with deepest possible insights.
Banks have long been suffering from the pain points of traditional ALM system:
- Overwhelming Computing Complexity: ALM has been traditionally a high-latency and low- frequency practice for most banks (or enterprises), mainly due to large volumes of data involved and computational complexity of attribution analysis, indicator computation or cross-indicator analytics.
- Coarse Granularity, Poor Flexibility: Traditional ALM systems built on top of RDBMS, big-data or lake-house frameworks share a common pitfall – cartesian product due to the joining(s) of multiple tables. When multiple tables must be joined during the attribution analysis (or back-tracing, simulation, stress testing, etc.) process, these ALM systems tend to run extremely slow, making it impossible to penetrate or correlate data for value extraction. This widely shared common pitfall on the IT infrastructure level has seriously bogged down any enterprise’s capability to drill down on their valuable ALM data.
- Siloed Systems, and No Unified Solution: Basel III mandates a full spectrum of regulatory requirements that banks are having hard times coping with. Without end-to-end solution, banks are risking having difficult times managing their infrastructure, datasets, reporting mechanisms in a unified, timely and effective way. On the other hand, most banks (and enterprises) are having different and siloed systems for deposits, loans, pricing/FTP, RWA, EVA, RAROC, LCR, NII, NIM, AUM, etc. Having a unified ALM system would make daily ALM management for both headquarters and branches much more productive and coherent.
Ultipa offers next-gen ALM/BI killer app solution that empowers banks, financial institutions and enterprise customers to have 360-degree overview of their assets and liabilities, and be proactive with their financial planning, pricing, budgeting, ROI, liquidity risk and indicator analysis, predication and management, including but not limited to deposits, loans, RWA, EVA, RAROC, LCR, Internet Rate, NII/NIM, capital, AUM, FTP, leverage-ratio and any other Basel-III compliant ALM indicators.
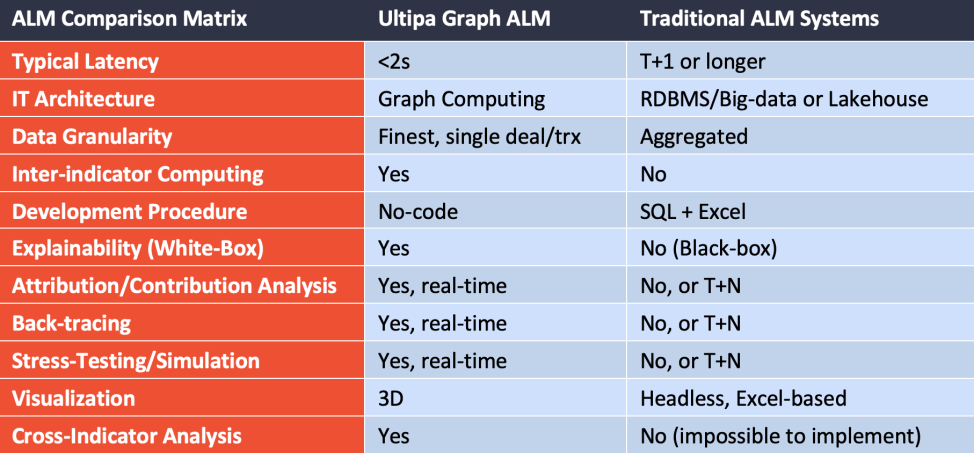
Powered with real-time graph computing, Ultipa ALM can be done with significant performance gain and augmented intelligence. The table below shows the main differences between Ultipa Graph ALM and traditional ALM systems:
Ultipa Graph ALM system is capable of managing all Basel III mandated factors, including, but not limited to:
- Liquidity Risk such as LCR
- Risk Weighted Asset (RWA)
- Product related: Deposits, Loans, FTP, product-pricing, etc.
- Interest related, such as NII, NIM, etc.
- AUM
- RAROC, EVA, etc.
- Leverage Ratio
- KPI and ROI related
All those aforementioned factors or indicators can be managed, computed, displayed, simulated, and back traced to its finest granularity in a fully explainable fashion (XAI), and in a highly interactive no-code way that business managers from both headquarters and branching centers can operate and experience in an intuitive Web GUI, as illustrated in the below diagram:
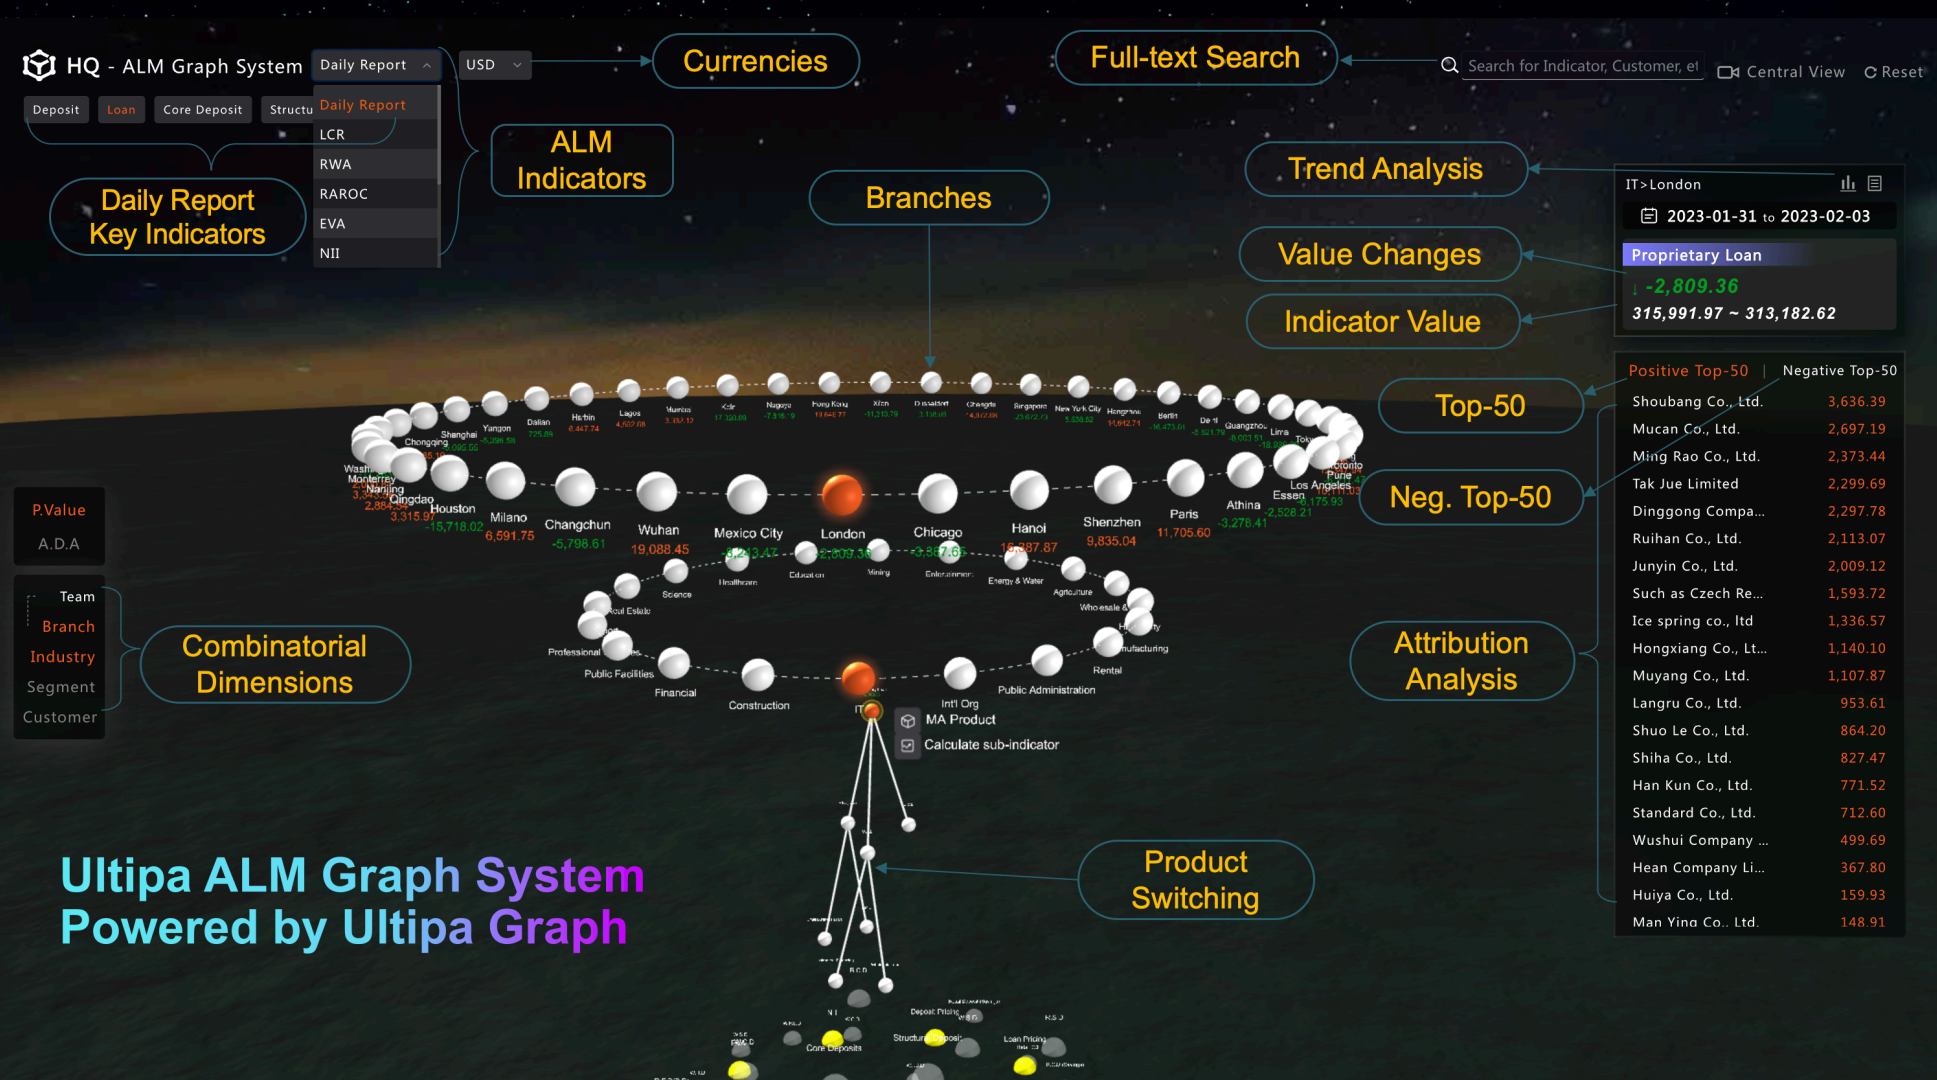
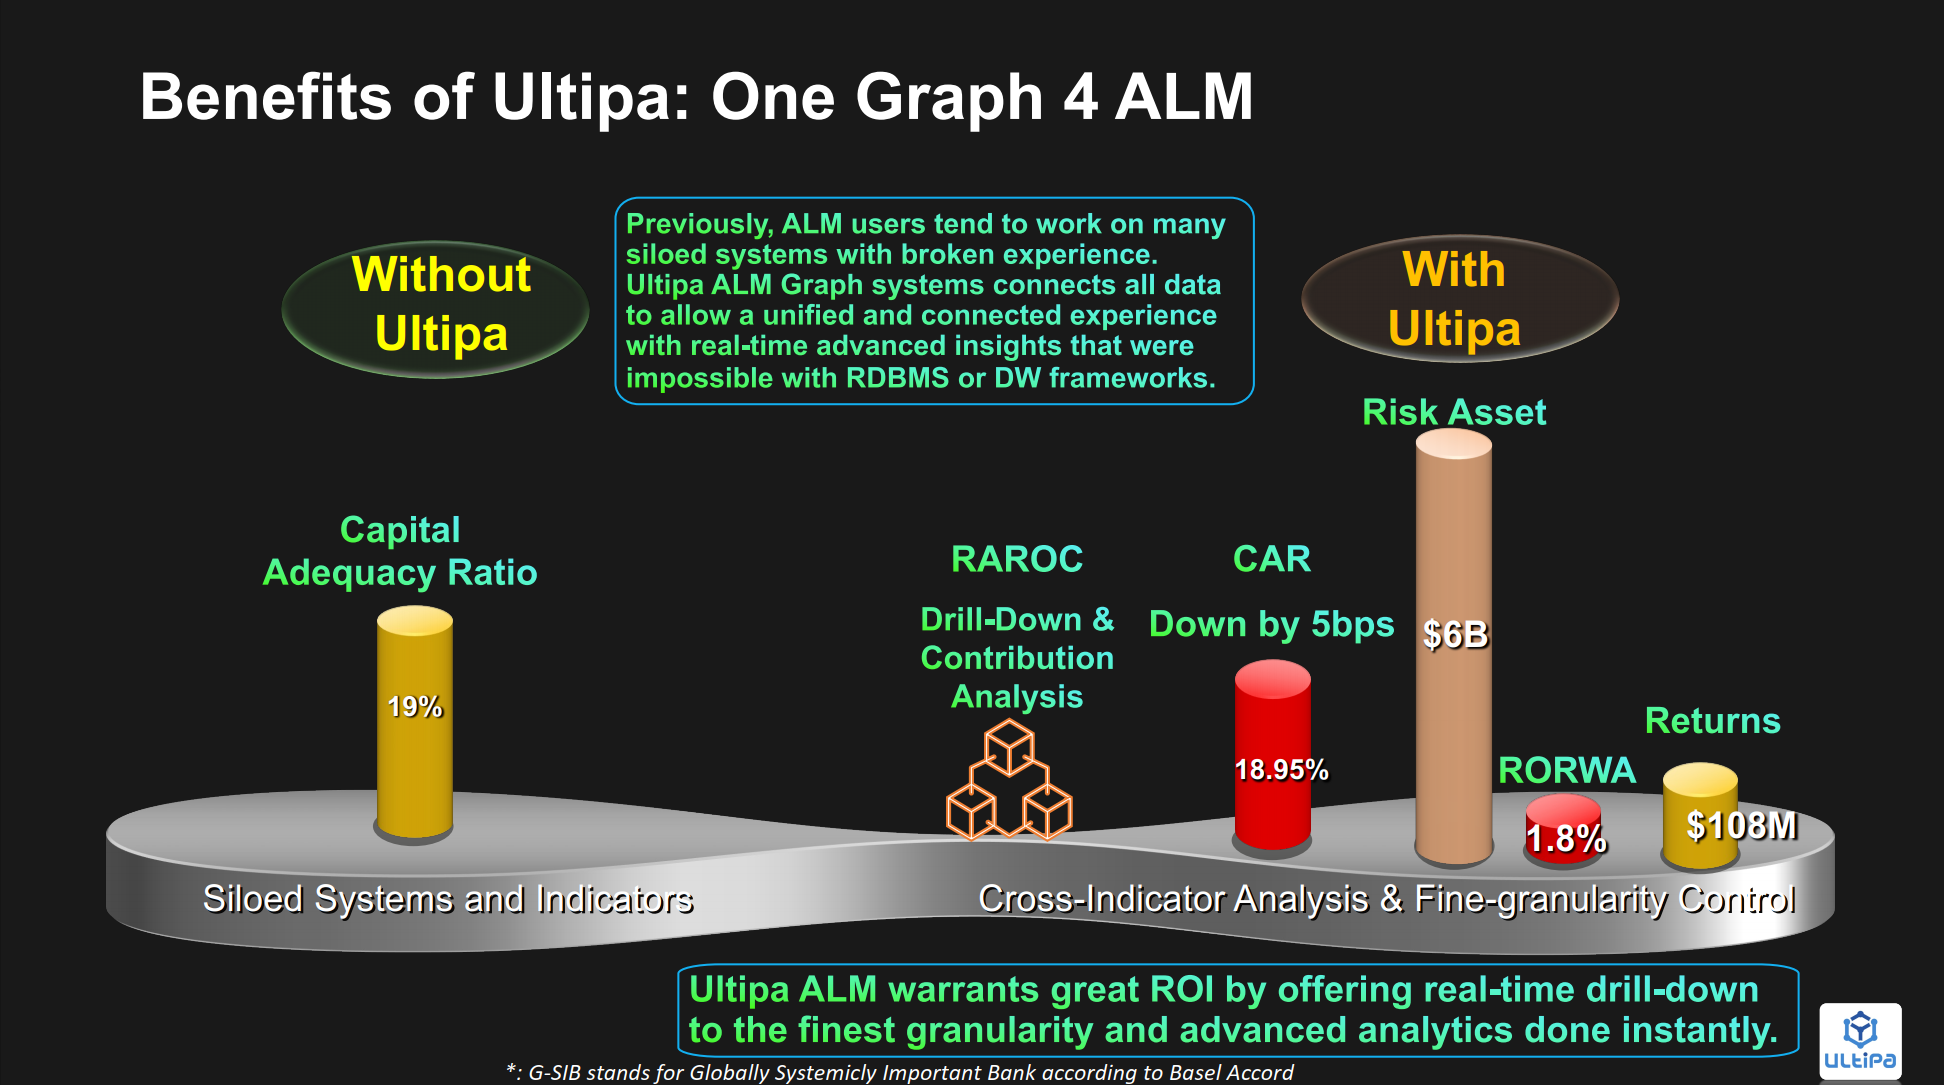
The Ultipa ALM solution offers lightning-fast white-box explainable graph computing against finest granularity financial data, real-time back-tracing, scenario simulation, decision-making, stress testing, contribution analysis and reporting, all of which offered in a highly visualized and interactive way to allow treasury and ALM professionals to stay on top of their valuable assets and liabilities with the help of graph augmented intelligence.
Ultipa ALM offers off-the-shelf end-to-end solution to our bank customers to help comb through their infrastructure, data, and reporting mechanism, and fill in the gaps in between with our real-time, graph database empowered, white-box, highly visualized and highly intuitive solution. It goes beyond the needs of regulatory compliance, but also satisfying business growth needs with a unified and deep data correlation approach, and 360-degree quantifiable insights of your crucial ALM data.