ULTIPA GRAPH Benchmark Report (2022)
July 3, 2022

1. Executive Summary
Ultipa has recently released v4.0 of its flagship Ultipa Graph database product. To recap Ultipa Graph v4.0's characteristics:
- Ultipa Graph v4.0 continues to evolve over its HTAP architecture for maximum speed, lowest latency and high throughput, great data consistency (across the entire cluster), and with advanced horizontal scalability. For those who are interested in graph database scalability design, refer to this article.
- Ultipa Graph Database is 10x to 1,000x+ faster than any other graph database systems in terms of data processing capabilities, the deeper the better.
- Ultipa Graph is the world’s only 4th-generation graph system, leveraging its patent-pending high-density parallel computing, ultra-deep graph traversal and dynamic graph pruning technologies.
- Ultipa is currently powering some of the world’s largest banks’ sophisticated and sea-volume data analytics and real-time decision making, anti-fraud, liquidity risk management, asset liability management, risk management systems, etc. Previously, no other systems have the capability to address customers’ challenges with such speed and celerity.
This benchmark focuses on examining the following characteristics of a graph system:
- Data Loading
- Graph Traversal
- K-Hop, Shortest Paths (All Paths), etc.
- Graph Algorithms
- PageRank, LPA, Louvain, Similarity, etc.
- Comparison with the following systems:
- Neo4j, TigerGraph, JanusGraph and ArangoDB
2. Testing Bed
2.1. Hardware Platform
The benchmark testing-bed cluster is composed of 3 cloud-based server instances with the following configurations:
| Server | Configuration |
| CPU | Intel Xeon 16-core (32-vCPU) |
| Memory | 256GB |
| Disk | 1TB HDD (Cloud-based) |
| Network | 5Gbps |
2.2. Software
|
Software |
excerpt |
|
OS |
Linux |
|
Graph Databases |
Ultipa Graph v4.0 Neo4j v4.0.7 Enterprise Edition TigerGraph v3.1 JanusGraph v0.6.1 ArangoDB v3.7 |
Note: Benchmark results across multiple graph databases are show under 3.2.3.
2.3. Dataset
|
Dataset |
excerpt |
|
Twitter-2010 | |
|
Dataset |
Twitter_rv.tar.gz Nodes: 41.6M, Edges: 1.47B (1,470M) |
|
Data Modeling |
Extend the dataset to allow nodes and edges to have properties. For instance, while running the PageRank/LPA/Louvain graph algorithms, results can be written back to the nodes as properties, which can be updated from time to time. |
3. Functional Testing
3.1 Summary of Functional Testing
|
Testing Items |
Testing Standards |
Ultipa Results |
|
Installation |
The total time to have the graph database system deployed (the installation phase). |
~30 min |
|
Extensibility |
Support of distributed architecture, data partitioning, horizontal and vertical scalability. |
HTAP Distributed Architecture, scalable both horizontally and vertically |
|
Graph Update |
Graph modeling update can happen without suspense or shutdown of services, including real-time updates to nodes and edges. |
Online update to vertices/edges, changes are reflected instantly to queries or algorithms’ results. |
|
Data Loading |
Support of batch or stream type of data loading; support of delimited text (i.e., CSV) or JSON format ingestion; support of stop-n-resume. |
Support |
|
Query Language |
Natively supports graph query language. |
Powerful UQL (Ultipa Query Language), easy-to-learn and easy-to-use. Can be tech and business personnel oriented at the same time. |
|
High-concurrency Query |
Ability to execute sophisticated graph queries in a highly concurrent fashion. |
Support |
|
Influence Algorithm |
Support of the LPA, PageRank graph algorithms. |
Support |
|
Community Detection Algorithms |
Support of the WCC/SCC, LPA and Louvain algorithms. |
Support |
|
Graph Interaction |
Support of meta-data interaction, modification, display, highlight, expansion, etc. |
Support |
|
Management & Monitoring |
Support of system run-time monitoring and management, such as CPU, RAM, Disk, networks, etc. |
Support |
|
Log Management |
Detailed logging mechanism. |
Support |
|
Graphsets/Graphs |
Support of multiple graphsets, sharing of nodes/edges across multiple graphs. |
Support |
|
Privilege Management |
User privilege, access-control mechanism. |
Support |
|
Backup & Restore |
Online backup and restoration support. |
Support |
|
High Availability |
Does the system support HA setup? |
Support |
|
Disaster Recovery |
Does the system support multi-city disaster recovery? |
Support |
3.2. Performance Testing
3.2.1. Summary of Ultipa’s Performance Testing
|
Testing Items |
Testing Standard |
Ultipa Testing Results |
|
Data Loading |
Ingesting 100% of the data of testing dataset, measure the total time. |
2,700s |
|
Storage Size |
Loaded data size versus raw data size |
1.3 |
|
1-Hop Query |
Given a seed file with multiple nodes, check each node’s total number of 1-hop neighbors, log average execution time. |
0.00062s (Average Time) |
|
2-Hop Query |
Given a seed file with multiple nodes, check each node’s total number of 2-hop neighbors, log average execution time. |
0.027s (Average) |
|
3-Hop Query |
Given a seed file with multiple nodes, check each node’s total number of 3-hop neighbors, log average execution time. |
0.520s (Average) |
|
6-Hop |
Given a seed file with multiple nodes, check each node’s total number of 6-hop neighbors, log average execution time. |
1.408s (Average) |
|
23-Hop |
Given a seed file with multiple node, check each node’s total number of 23-hop neighbors, log average execution time. |
1.295s (Average) |
|
Shortest-Path |
Given any random pair of nodes, count their total number of shortest paths, mark the calculation time. |
0.18s (Average) |
|
Topology-Change & Query Results Change |
Change the topology of the dataset, examine query results change (i.e., K-hop results of a particularly affected node). |
In Real-time |
|
Jaccard Similarity |
Calculate and return Top-10 nodesbased on Jaccard Similarity against 10 nodes, log average execution time. |
4.99s |
|
PageRank |
PageRank algorithm. Each algorithm is run multiple times, log the average time. |
23s |
|
LPA |
Label Propagation Algorithm. Each algorithm is run multiple times, log the average time. |
80s |
|
Louvain |
Louvain community detection algorithm. Each algorithm is run multiple times, log the average time. |
210s |
3.2.2. Itemized Performance Testing
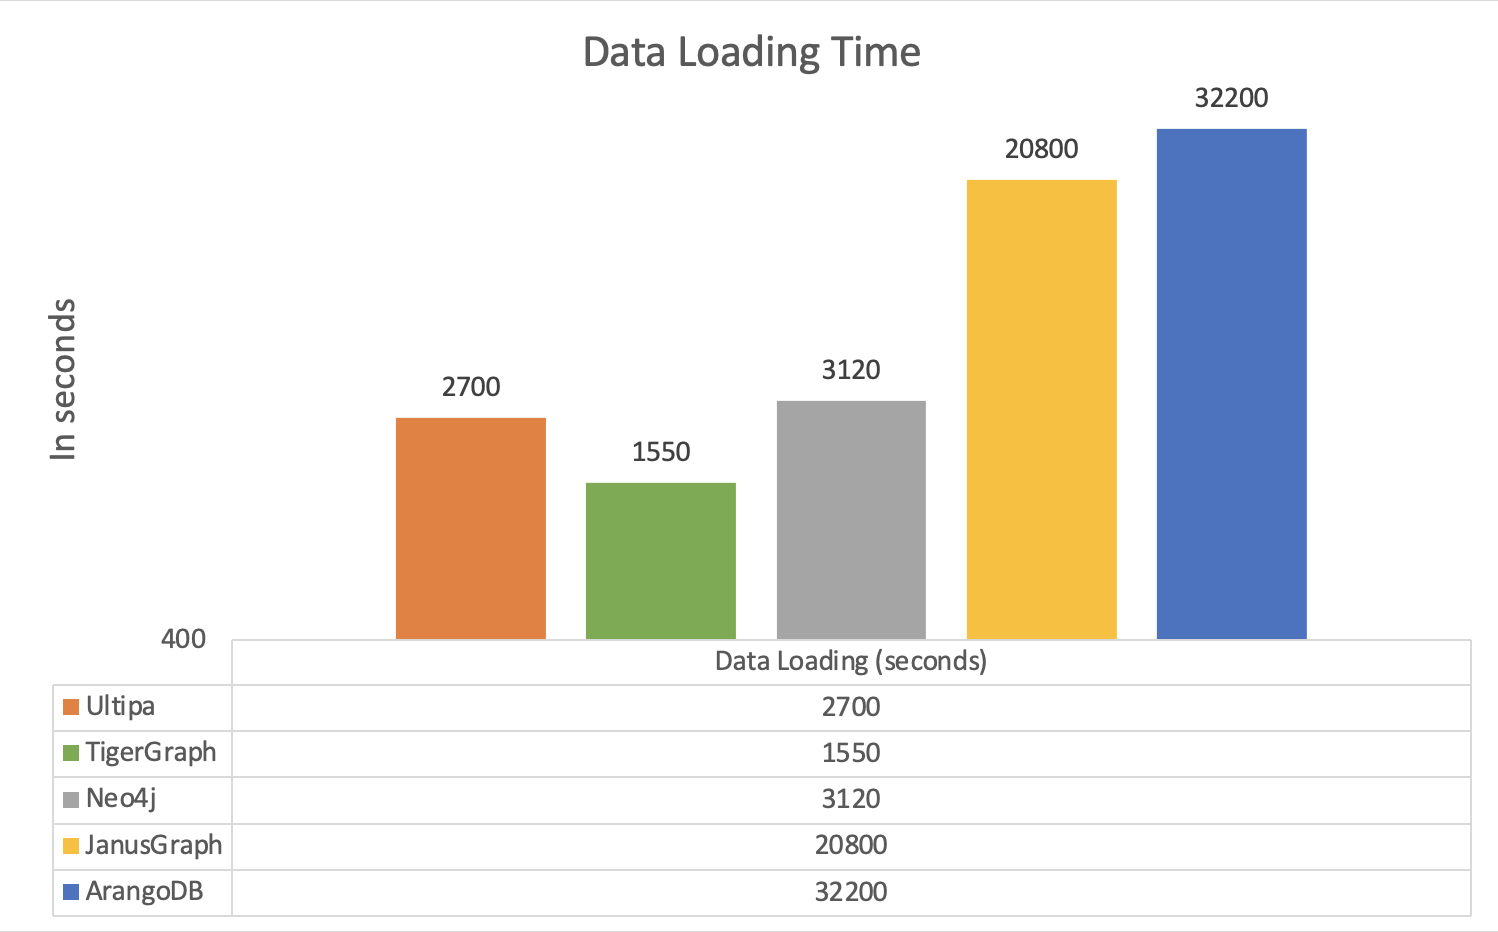
3.2.2.1. Data Loading
Testing Purpose: Loading the entire dataset into graph database and start providing services. This test can show how fast a graph system ingest large volume of data.
Ultipa Testing Results:
|
Testing Item |
excerpt |
# of Nodes |
# of Edges |
Loading Time |
|
Data Loading |
Mark the total time for the entire dataset is loaded and system up-n-running. |
41,652,330 |
1,468,365,182 |
2,700 seconds |
Testing Results by All Systems:
|
Dataset |
Twitter-2010 | ||||
|
Graph System |
Ultipa |
TigerGraph |
Neo4j |
JanusGraph |
ArangoDB |
|
Loading Time(s) |
2,700 |
1,550 |
3,120 |
20,800 |
32,200 |
|
Time Normalized |
1.7 |
1 |
2 |
13.4 |
20.8 |
|
Storage Size |
30GB |
24GB |
55GB |
56GB |
128GB |
|
Size Normalized |
1.25 |
1 |
2.3 |
2.3 |
5.3 |
3.2.2.2. K-Hop Neighbor Querying
Testing Purpose:K-hop query is a fundamental type of query with any graph system. It allows user to quickly identify the scope of impact of an entity (the subject node). K-hop must be implemented using BFS (Breadth-First Search) method, and there are a few caveats:
- There are usually 2 ways of defining K-Hop and the results are different. One way is all neighbors from the 1st hop all the way to the Kth hop, the other way is the neighbors exactly Kth hop away from the starting node.
- If a node appears on the Nth hop of a specific node, it will NOT appear on any other hop. While executing the algorithm, it’s pivotal to conduct de-duplication of nodes across different hops, otherwise, the results would be wrong.
- The number of a node’s immediate neighbors are NOT the same as the number of edges, because a pair of connecting nodes may have 2 edges connecting them bi-directionally.
Ultipa Testing Results:
Note: The below testing results pertaining to Ultipa system log the number of nodes on the Nth hop. For K-hop query, this is slightly more time consuming than other systems calculating only the total number of nodes from 1st all the way up to the Kth hop.
|
Testing Item |
Item excerpt |
Node ID |
# of Neighbors at Nth Hop |
Execution Time (ms) |
Average Execution Time (ms) |
|
1-Hop |
For each node, query for the # of nodes that are exactly 1-hop away, log execution time. |
20727483 |
973 |
0.509ms |
0.62ms |
|
50329304 |
4,746 |
0.815 | |||
|
26199460 |
19,954 |
0.868 | |||
|
1177521 |
4,272 |
0.777 | |||
|
27960125 |
7 |
0.484 | |||
|
30440025 |
3,386 |
0.733 | |||
|
15833920 |
2,181 |
0.505 | |||
|
15015183 |
2,279 |
0.492 | |||
|
33153097 |
116 |
0.491 | |||
|
21250581 |
37 |
0.536 | |||
|
2-Hop |
For each node, query for the # of nodes that are 2-hop away, log execution time. |
20727483 |
2,874,132 |
5.823ms |
27.33ms |
|
50329304 |
2,714,697 |
5.606 | |||
|
26199460 |
7,818,213 |
69.953 | |||
|
1177521 |
19,318,826 |
70.281 | |||
|
27960125 |
533,108 |
1.983 | |||
|
30440025 |
11,294,131 |
21.967 | |||
|
15833920 |
7,858,255 |
22.746 | |||
|
15015183 |
5,933,114 |
27.222 | |||
|
33153097 |
12,181,518 |
25.157 | |||
|
21250581 |
11,063,971 |
22.537 | |||
|
3-Hop |
For each node, query for the # of nodes that are 3-hop away, log execution time. |
20727483 |
27,206,363 |
400.011ms |
520ms |
|
50329304 |
29,939,223 |
407.992 | |||
|
26199460 |
31,324,330 |
526.919 | |||
|
1177521 |
17,139,727 |
741.438 | |||
|
27960125 |
20,280,156 |
101.114 | |||
|
30440025 |
23,120,607 |
748.711 | |||
|
15833920 |
26,263,805 |
649.454 | |||
|
15015183 |
27,727,527 |
475.516 | |||
|
33153097 |
20,512,136 |
507.208 | |||
|
21250581 |
20,804,932 |
641.811 | |||
|
6-Hop |
For each node, query for the # of nodes that are 6-hop away, log execution time. |
20727483 |
10,028 |
1213.226ms |
1408.28ms |
|
50329304 |
9,052 |
1510.373 | |||
|
26199460 |
3,022 |
1372.880 | |||
|
1177521 |
3,101 |
1220.169 | |||
|
27960125 |
25,838 |
1576.181 | |||
|
30440025 |
5,437 |
1659.473 | |||
|
15833920 |
5,618 |
1210.724 | |||
|
15015183 |
6,197 |
1320.371 | |||
|
33153097 |
6,033 |
1229.563 | |||
|
21250581 |
6,738 |
1769.825 | |||
|
23-Hop |
For each node, query for the # of nodes that are 23-hop away, log execution time. |
15738828 |
3 |
1203.212ms |
1295.19ms |
|
9358362 |
1 |
1279.990 | |||
|
9358352 |
1 |
1529.716 | |||
|
17571568 |
1 |
1167.854 |
|
Ultipa Query Language: |
Testing Results by All Systems:
|
Dataset |
Twitter-2010 | ||||
|
Graph System |
Ultipa |
TigerGraph |
Neo4j |
JanusGraph |
ArangoDB |
|
1-Hop (second) |
0.00062 |
0.024 |
0.2 |
0.39 |
1.667 |
|
2-Hop (second) |
0.055 |
0.46 |
18.3 |
27.7 |
28.9 |
|
3-Hop (second) |
0.52 |
6.6 |
290 |
4300 |
3888 |
|
6-Hop (second) |
1.82 |
62.5 |
N/A |
N/A |
N/A |
|
23-Hop (second) |
1.92 |
N/A |
N/A |
N/A |
N/A |
.png)
3.2.2.3. Shortest Paths
Testing Purpose: Finding shortest paths is a fundamental type of graph query. Like K-hop query, it is also implanted using BFS method, namely breadth-first search. The caveat with Shortest Path finding is that there are usually multiple paths instead of one, some graph systems can NOT return the correct number of paths due to faulty implementation. It’s often more challenging to query for shortest paths on large dataset like Twitter, therefore it’s meaningful to examine how swiftly a graph system can run this query.
Testing Results: Find all shortest paths between any pair of nodes and log the execution time and total number of paths.
|
Testing Item |
Item excerpt |
Starting Vertex |
End Vertex |
# of Shortest Paths |
Execution Time |
Average Execution Time |
|
Find All Shortest Paths between Random Pairs of Nodes |
For any pair of nodes, query for all the shortest paths between them, log the execution time and total # of paths. |
50329304 |
21613682 |
25389 |
0.152s |
0.18s |
|
49449489 |
15645246 |
2080710 |
2.484s | |||
|
39687658 |
47978366 |
46 |
0.053s | |||
|
15489748 |
38548456 |
8 |
0.017s | |||
|
17524616 |
29884615 |
5 |
2.22s | |||
|
33033471 |
37029346 |
273 |
0.018 | |||
|
37048837 |
17555248 |
1114 |
0.01s | |||
|
26895497 |
37893465 |
2 |
0.004s | |||
|
26468497 |
37164965 |
6 |
0.002s | |||
|
54151557 |
37190965 |
30837 |
0.05s |
|
Ultipa Query Language |
|
ab().src({_id == Starting_Node_ID}).dest({_id == Ending_Node_ID}).depth(6).shortest().boost() as paths return count(paths) |
Testing Results by All Systems:
|
Dataset |
Twitter-2010 | ||||
|
Graph Database |
Ultipa |
TigerGraph |
Neo4j |
JanusGraph |
ArangoDB |
|
All Shortest Paths (in seconds) |
0.18 |
9.2 Note: Some ≥6-hop paths can’t return in 10-min. |
Can’t return any ≥3-Hop paths. |
Can’t return any ≥3-Hop paths. |
Can’t return # of paths correctly (only 1 path found) |
.png)
3.2.2.4. PageRank
Testing Purpose: Iterative algorithm like PageRank can be used to validate
Testing Results: It is imperative that PageRank algorithm should be conducted in an iterative fashion that traverses all nodes and edges. Some graph databases, by default, do this wrongly. Neo4j is one such example, it allows running the algorithm on limited number of vertices instead of on ALL the vertices. On the other hand, returning results in an ordered way is useful in determining the top-ranked pages (nodes or entities), unfortunately, many graph systems do NOT support result-ranking natively.
|
Testing Item |
Item excerpt |
Ultipa Testing Results Top-10 Highest Ranked Vertices |
Execution Time (in seconds) |
|
Impact Analysis |
Run PageRank algorithm for 10 iterations, with damping-0.8, return the top-10 highest ranked vertices and their rankings, log the total execution time. |
813286,14276.1 14224719,12240 31567254,10288.6 15131310,9860.32 16049683,8546.38 7040932,6775.97 14075928,6672.9 12687952,5345.58 5380672,5021.32 26784273,2886.91 |
23s |
|
Ultipa Query Language: |
|
algo(page_rank).params({order:’desc’,init_value:0.2,loop_num:10,damping:0.8,limit:10}).write({file:{filename:”my_pagerank_result”}}) |
Note: The chart below shows how Ultipa compares with Tigergraph and other systems. Please note that ONLY Ultipa returns the PageRank results in an ordered way, which is more time consuming. The systems that do not carry a result couldn’t finish the algorithm.
.png)
3.2.2.5. Community Detection
Testing Purpose: LPA and Louvain are the two commonly used community detection algorithms. It’s useful to verify how fast and swiftly can a graph database system finish both algorithms on a relatively large dataset such as Twitter with over 1.5 billion nodes and edges.
Testing Results:
|
Testing Item |
Item excerpt |
# of Communities |
Execution Time (in seconds) |
|
LPA |
Launch the LPA algorithm, set iterations=10, print out # of communities and total execution time. |
116602 |
80s |
|
Louvain |
Launch the Louvain Community Detection algorithm, set iterations=10, modularity=0.01, print out # of communities and total execution time. |
1207 |
210s |
|
Ultipa Query Language: |
algo(lpa).params({loop_num:10}).write()algo(louvain).params({phase_1_loop_num:10.min_modularity_increase:0.01}).write |
Testing Results by All Systems:
|
Dataset |
Twitter(2010): 41.6M, 1470M, 24.6GB | ||||
|
Graph DB |
Ultipa |
TigerGraph |
Neo4j |
JanusGraph |
ArangoDB |
|
PageRank (Seconds) |
23 |
258 |
600 |
N/A Unfinished |
N/A Unfinished |
|
LPA (Seconds) |
80 |
900 |
N/A Unfinished |
N/A Unfinished |
N/A Unfinished |
|
Louvain (Seconds) |
210 |
N/A Not-Tested |
N/A Can’t finish projection in 30-min |
N/A Not-Tested |
N/A Not-Tested |
Not: Due to resource or feature limitations, the following tests were only conducted against Ultipa Graph v4.0 but not on other graph database systems.
3.2.2.6. Update Dataset and Compare Query Results
Testing Purpose: To validate if the graph database system has the ability to update data contents and allow for accurate data querying in real-time. It is not uncommon that some graph systems use caching mechanism to pre-calculate and store-aside results which do NOT change accordingly after the data contents are change. In this testing item, we create a new edge connecting the provided starting vertex with one of its 3rd-hop neighboring vertex, and compare the 1-to-3-to-6 Hop results before and after the edge is inserted.
Testing Results:
|
Testing Item |
Item excerpt |
New-Edge Starting Vertex ID |
New-Edge Ending Vertex ID |
Query Depth |
K-Hop Before Edge Adding |
K-Hop After Edge Adding |
|
Update the dataset, do queries against it twice to compare results |
Add a new edge between the starting vertex to one of its 3rd-hop neighboring vertex, and check its 1-hop,3-hop, 6-hop results before and after the edge-adding event |
20727483 |
28843543 |
1 |
973 |
974 |
|
3 |
27206363 |
27210397 | ||||
|
6 |
10028 |
10027 | ||||
|
50329304 |
21378173 |
1 |
4746 |
4747 | ||
|
3 |
29939223 |
29939314 | ||||
|
6 |
9052 |
9052 | ||||
|
26199460 |
32278263 |
1 |
19954 |
19955 | ||
|
3 |
31324330 |
31324333 | ||||
|
6 |
3022 |
3022 | ||||
|
1177521 |
6676222 |
1 |
4272 |
4273 | ||
|
3 |
17139727 |
17139725 | ||||
|
6 |
3101 |
3101 | ||||
|
27960125 |
48271231 |
1 |
7 |
8 | ||
|
3 |
20280156 |
20283107 | ||||
|
6 |
25838 |
25836 | ||||
|
30440025 |
38232241 |
1 |
3386 |
3387 | ||
|
3 |
23120607 |
23121930 | ||||
|
6 |
5437 |
5431 |
3.2.2.7. Similarity Algorithm
|
Testing Item |
Testing Item excerpt |
Provided ID of Starting Vertex |
Execution Time |
Average Time in Seconds |
|
Similarity |
Given a vertex, query for Top-10 vertices that are most similar using Jaccard Similarity. |
20727483 |
1.586s |
4.99s |
|
50329304 |
2.003s | |||
|
26199460 |
10.573s | |||
|
1177521 |
10.52s | |||
|
27960125 |
0.359s | |||
|
30440025 |
2.865s | |||
|
15833920 |
5.042s | |||
|
15015183 |
5.283s | |||
|
33153097 |
5.201s | |||
|
21250581 |
4.525s |
|
Ultipa Query Language: |
|
find().nodes({_id == Provided_ID}) as n with n algo(similarity).params({uuids:[n],top_limit:10,type:"jaccard"}) as r return r |
4. Conclusion
Benchmarks help us understand how a system performs in comparison with other systems.
Admittedly, it's difficult to fine tune every single system to its optimal state (i.e., with better looking numbers), therefore, other vendors may have different opinions about why their systems seem to be underperforming.
The argument here, however, is that Ultipa Graph database is the 1st system that has been designed from scratch to serve complicated graph queries (and evn algorithms) in real-time. Our entire architecture, data structure, graph computing engine, storage engine, graph query engine, API/SDK, toolchains were all designed and implemented in a way to serve this real-time-ness. As we are spreading into more and more commerical and industrial fields, we (and hopefully you too) will see that our concept of graph augmented intelligence and eXplainable AI (XAI) can empower smart enterprises smoothly transforming digitally with speed and ease.
To best understand a graph vendor's product, you should also look at things beyond just the numbers in the benchmarks, and here are some recommended readings:
- How to verify the graph database benchmark results
- How to design a highly scalable graph database system
We hope you enjoy the reading and internalize the cool stuff within.
May the best graph be with you.