Result Table and Visualization
Even though GQL operates on graphs, its results are still logically represented as tables composed of records (rows).
Intermediate Result Table
The intermediate result table is a conceptual model to understand how queries are processed.
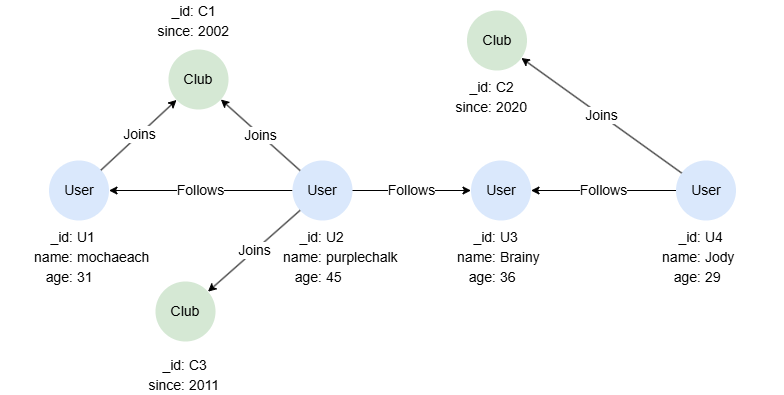
Here is the example graph and query:

GQLMATCH (u:User) WHERE u.age > 30
MATCH (u)->(c:Club)
FILTER c.since > 2010
RETURN u.name, c._id
| Statement | Intermediate Result Table | ||||||||
|---|---|---|---|---|---|---|---|---|---|
MATCH (u:User)WHERE u.age > 30 | The intermediate table contains one column (variable) u with three records (rows).
| ||||||||
MATCH (u)->(c:Club) | The statement evaluates u row by row and adds a new column c to the intermediate result table:
| ||||||||
FILTER c.since > 2010 | The statement evaluates c row by row and discards records that don't meet the filtering condition.
| ||||||||
| Statement | Output Table | ||||||||
RETURN u.name, c._id | The RETURN statement defines the output table.
|
This example is a linear query, where statements are executed sequentially. In composite queries, each linear query is executed independently and produces its own output table. These output tables are then combined using the specified conjunction method.
Order of Rows
Without an explicit use of ORDER BY, Ultipa is free to return the result rows in any order — and that order may:
- Vary between query runs
- Change after database updates
- Differ across Ultipa versions
Cartesian Product in Queries
A Cartesian product occurs in GQL when query parts have no shared variables or explicit connections between them. In such cases, all combinations of the result rows from each part are returned.
Consider the example:
GQLMATCH (u:User)
MATCH (c:Club)
RETURN u.name, c._id
There are 4 User nodes and 3 Club nodes. Since there’s no relationship between u and c, the query produces a Cartesian product, yielding 4*3 = 12 records:
u.name | c._id |
|---|---|
| Jody | C1 |
| purplechalk | C1 |
| mochaeach | C1 |
| Brainy | C1 |
| Jody | C3 |
| purplechalk | C3 |
| mochaeach | C3 |
| Brainy | C3 |
| Jody | C2 |
| purplechalk | C2 |
| mochaeach | C2 |
| Brainy | C2 |
While this is a small example, in a real-world graph with large datasets, Cartesian products can lead to huge result sets, consuming significant memory and degrading performance. Therefore, avoid Cartesian products unless they are explicitly intended.
Result Visualization
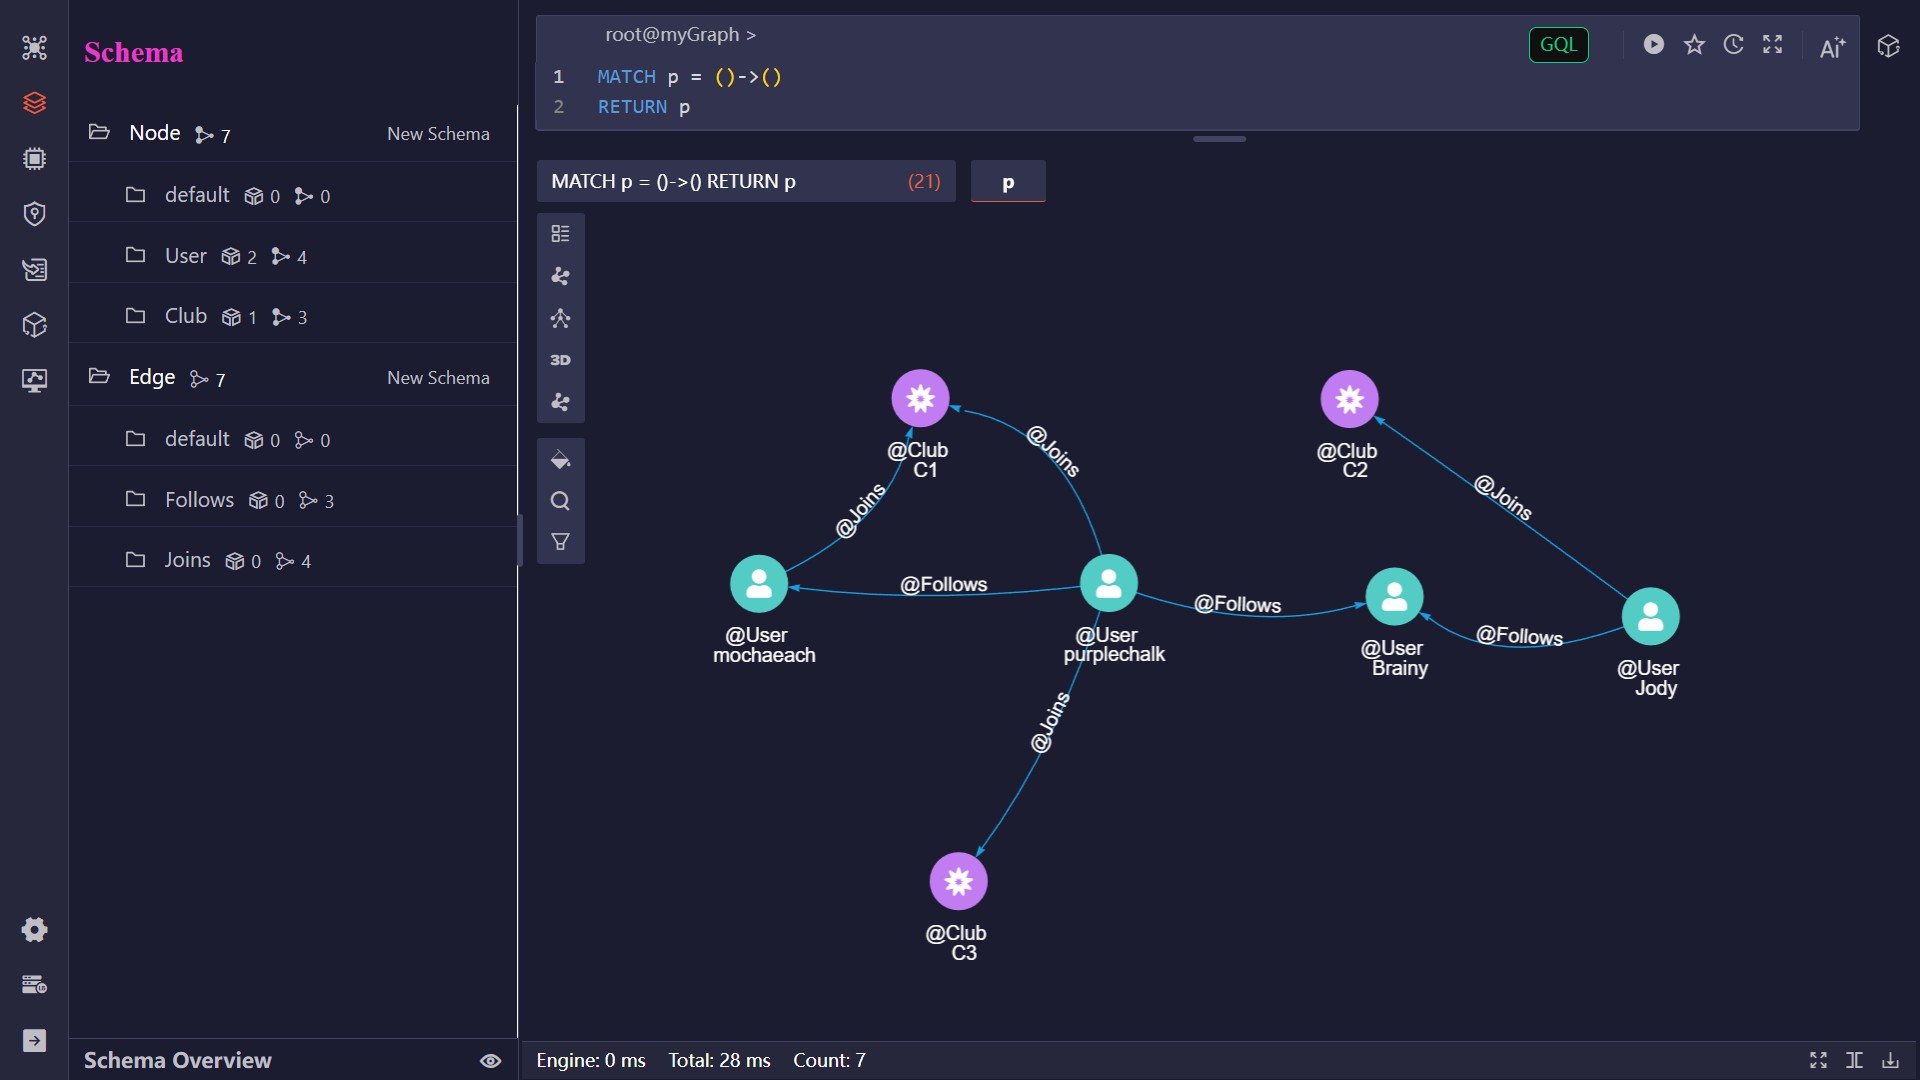
While GQL results can be returned in tabular format, one of the defining features of graph databases is the ability to visualize results as graph structures, making it easier for users to see and explore the relationships within their data.
When running GQL queries in Ultipa products such as Ultipa Manager and GQL Playground, query results of nodes and paths can be rendered in graph view, offering an intuitive and interactive way to navigate the result graph.
 Result Visualization in Ultipa Manager