
Ultipa Manager is a web-based application designed for managing Ultipa graph databases. It caters to a diverse user base including developers, data scientists, database administrators, and business professionals.
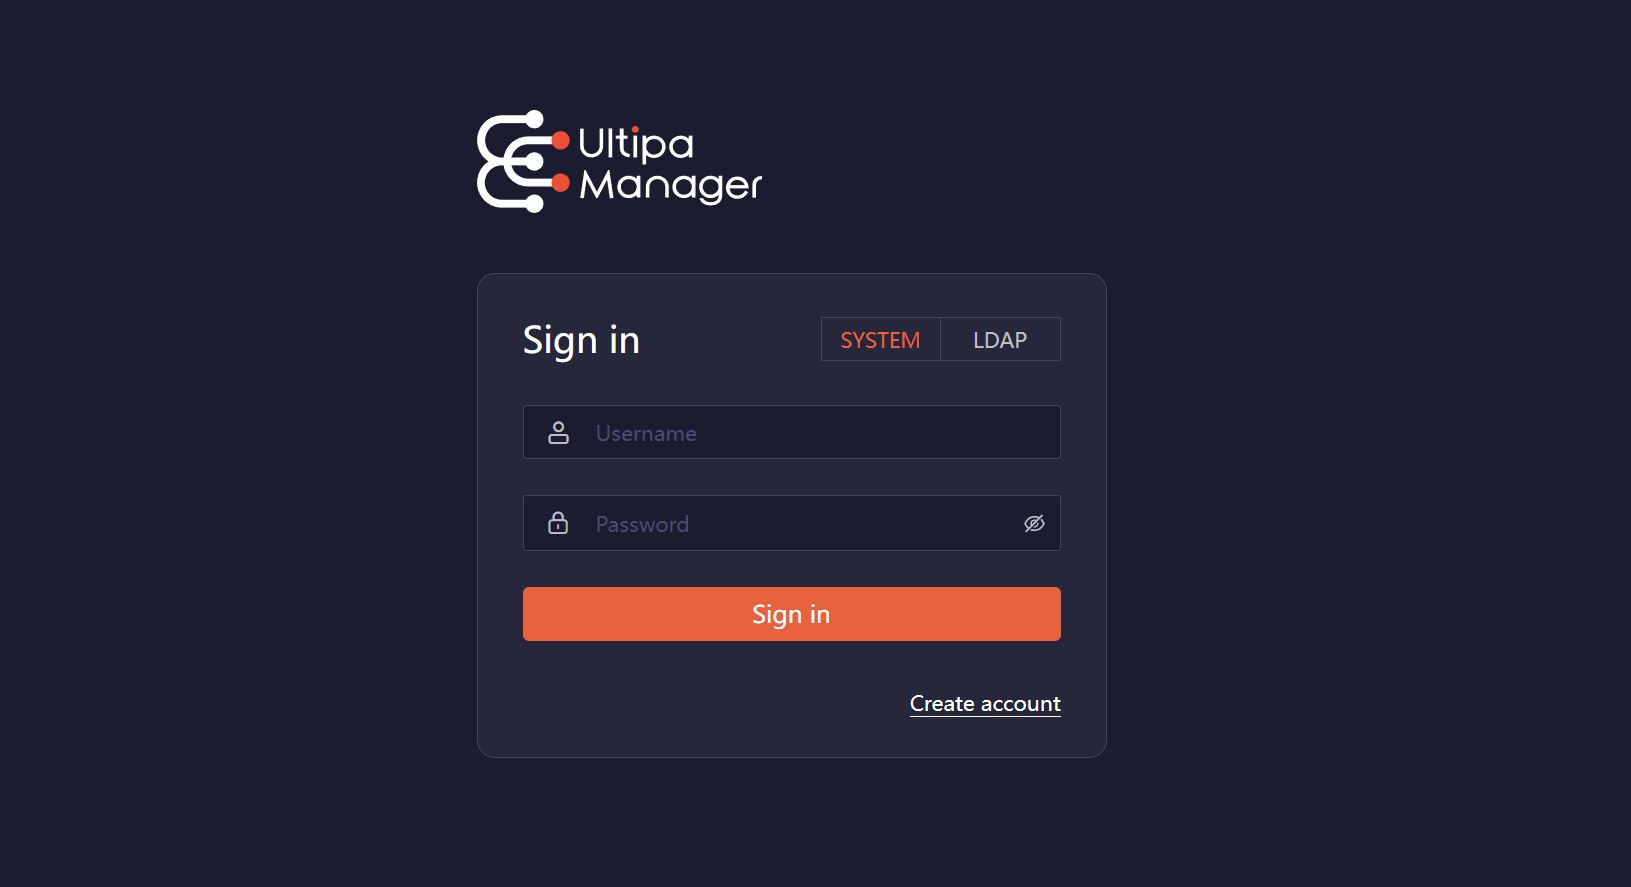
Log in to Manager
To begin, open your browser and navigate to the address where Ultipa Manager is deployed. Log in using your Manager account. If you don't have an account, click Create account to register.
Related Links:
- Managing users, roles, and groups
- Using LDAP for authentication
- Enabling MFA for login
- Enforing a password strength rule
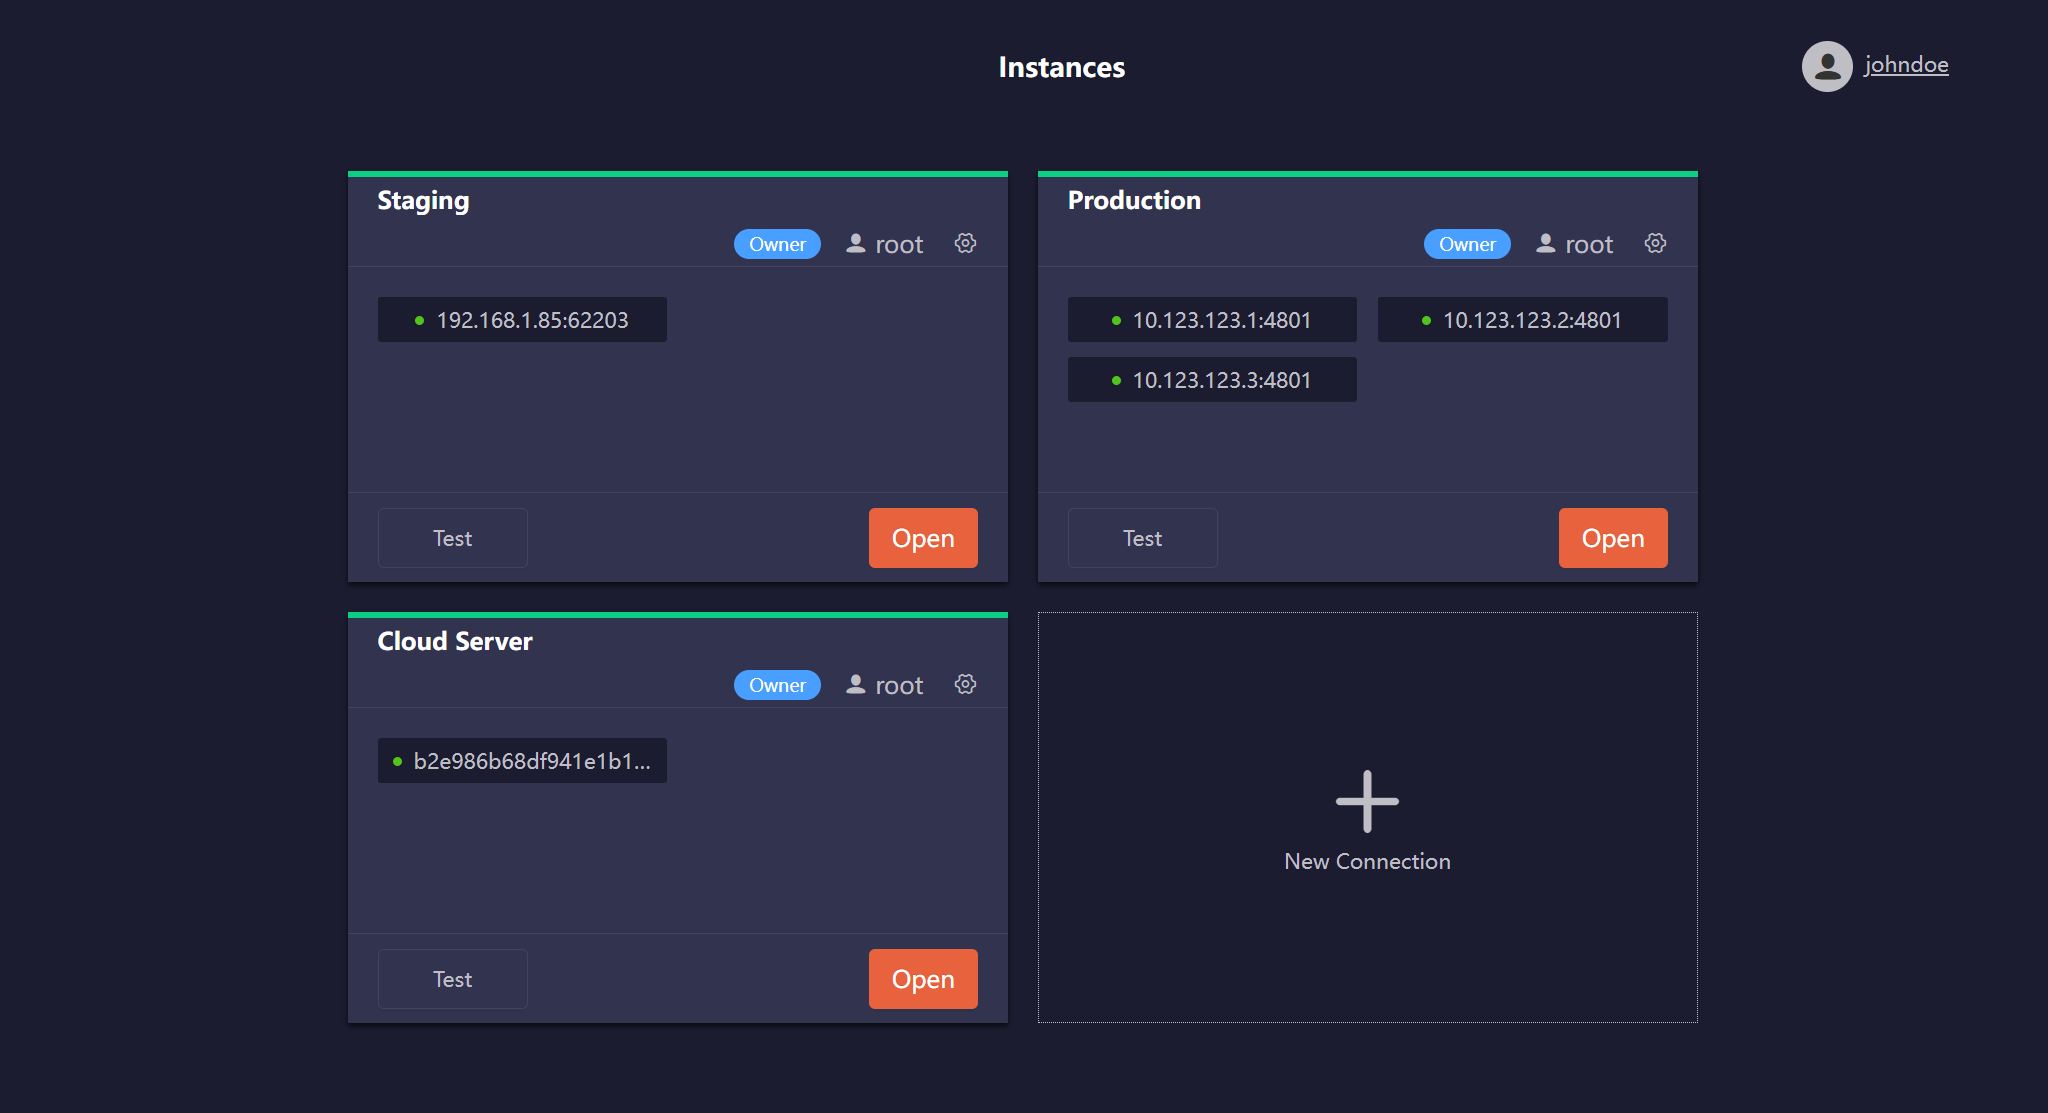
Add Connections
After logging in, you will be directed to the Instances page, where you can add connections to your Ultipa graph databases.
Click New Connection and complete the following settings:
- Hosts: A comma-separated list of database server IPs or URLs (excluding the
http://orhttps://protocol prefix).- IP example:
10.123.123.1:4801,10.123.123.2:4801,10.123.123.3:4801 - URL example:
b2e986b68dxxxxx.eu-south-1.cloud.ultipa.com:8443
- IP example:
- Username: A database username of the host authentication.
- Password: Password of the above database user.
- Name: Optional. A custom name for the connection.
Related Links
- How to check the connection status
- Sharing connections with other users or groups
- Overseeing connections as an admin
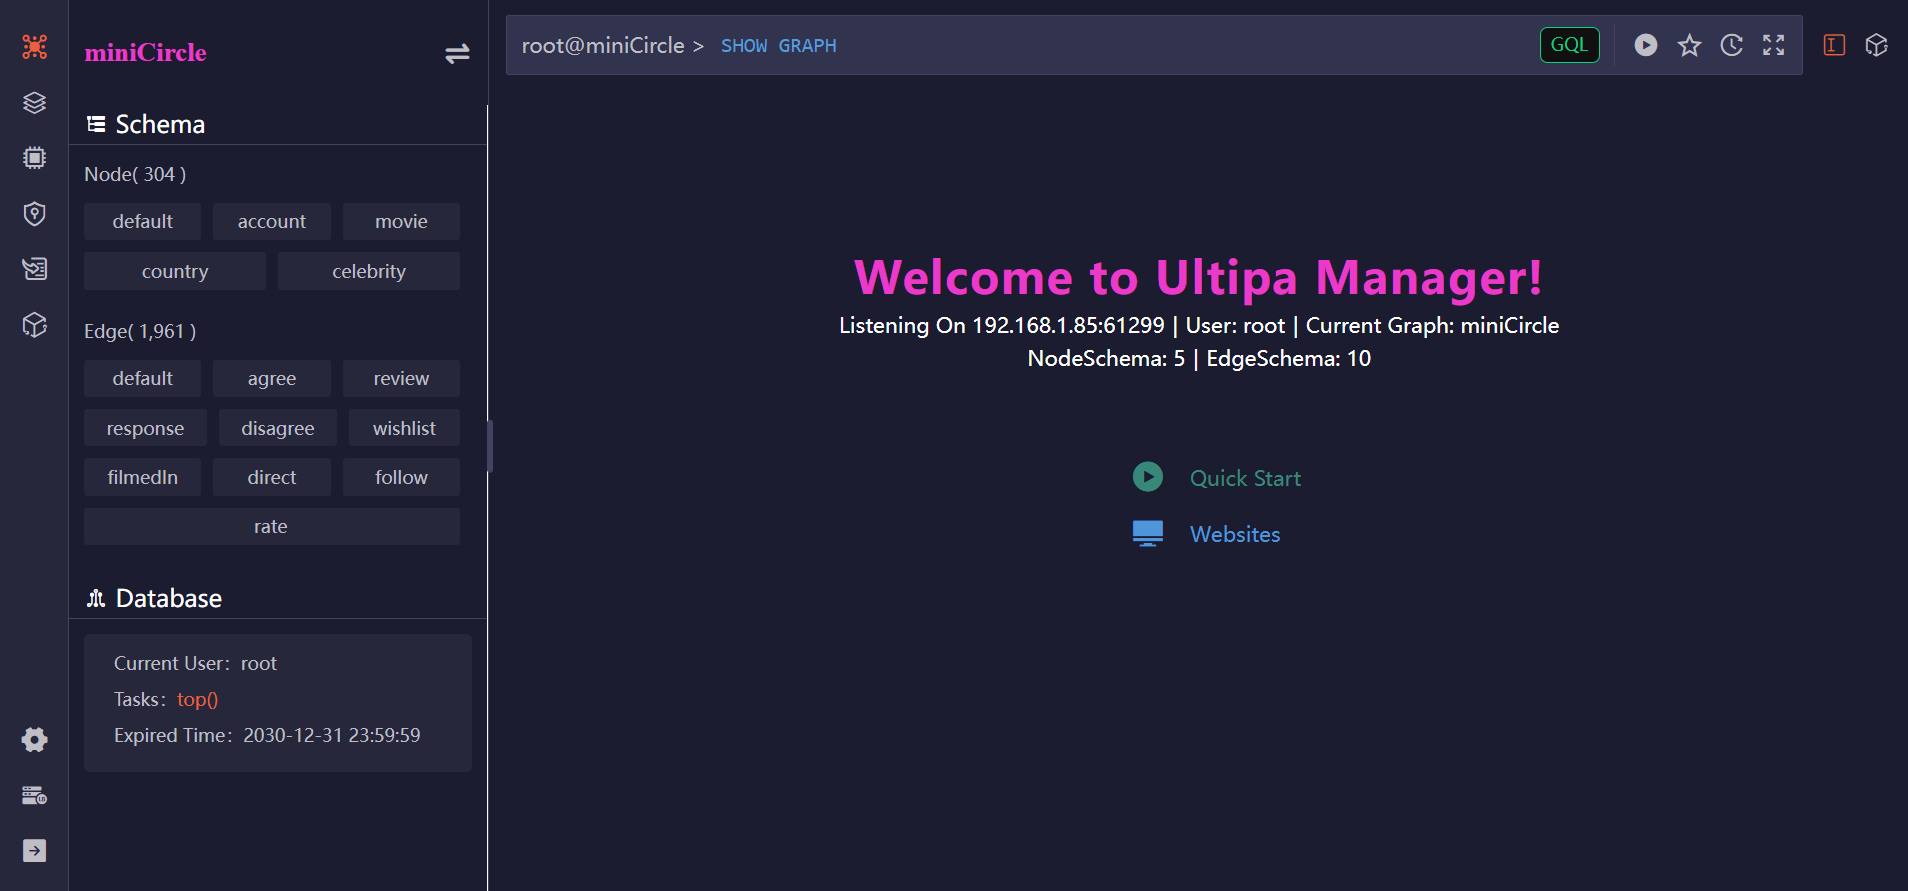
Work with Your Database
From the Instances page, click the Open button on a connection card to access the corresponding database:
Related Links
Ultipa Manager provides a comprehensive suite of features to help you interact with and manage your graph databases:
Manage Graphs, Structure, and Data
Access and manage the graphs within your database—modify their structures and update data. Learn more
Run Queries
Execute GQL or UQL to query data, run algorithms, manipulate graphs and the database. Learn more
Results Visualization
Display query results and graph data through rich visualizations with customizable layouts and styles. Learn more
HDC (High-Density Computing)
Manage HDC graphs and leverage nearly 60 graph algorithms with high-performance, in-memory computing. Learn more
Load Data
Import data from a variety of sources and transform them into graph structures within Ultipa. Learn more
Manage Database Access
Manage database users and policies (roles), and assign precise privileges across the database and Ultipa Manager. Learn more
Develop Widgets
Build and integrate custom applications that interact with your graph data. Learn more
Availability
Ultipa Cloud
In the instance of Ultipa Cloud, you can access Ultipa Manager by selecting CONNECT > Ultipa Manager.
On-Premises
For on-premises deployment, please reach out to us at [email protected].