
HDC
Overview
The Pearson correlation coefficient is the most common way of measuring the strength and direction of the linear relationship between two quantitative variables. In the graph, nodes are quantified by N numeric properties (features) of them.
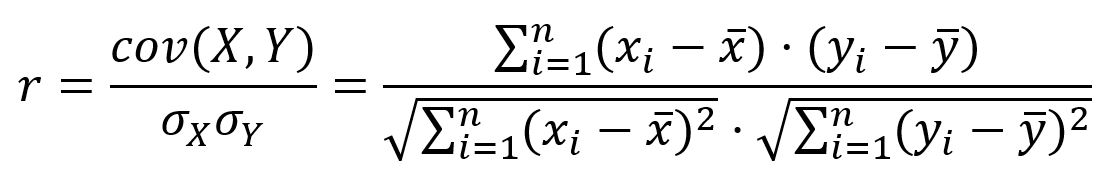
For two variables X= (x1, x2, ..., xn) and Y = (y1, y2, ..., yn) , Pearson correlation coefficient (r) is defined as the ratio of the covariance of them to the product of their standard deviations:
The Pearson correlation coefficient ranges from -1 to 1:
Pearson correlation coefficient |
Correlation type |
Interpretation |
|---|---|---|
| 0 < r ≤ 1 | Positive correlation | As one variable becomes larger, the other variable becomes larger |
| r = 0 | No linear correlation | (May exist some other types of correlation) |
| -1 ≤ r < 0 | Negative correlation | As one variable becomes larger, the other variable becomes smaller |
Considerations
- Theoretically, the calculation of Pearson correlation coefficient between two nodes is independent of their connectivity.
Example Graph
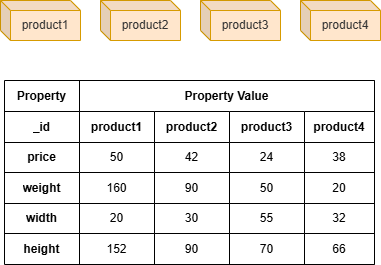
Run the following statements on an empty graph to define its structure and insert data:
ALTER GRAPH CURRENT_GRAPH ADD NODE {
  product ({price int32, weight int32, width int32, height int32})
};
INSERT (:product {_id:"product1", price:50, weight:160, width:20, height:152}),
       (:product {_id:"product2", price:42, weight:90, width:30, height:90}),
       (:product {_id:"product3", price:24, weight:50, width:55, height:70}),
       (:product {_id:"product4", price:38, weight:20, width:32, height:66});
create().node_schema("product");
create().node_property(@product, "price", int32).node_property(@product, "weight", int32).node_property(@product, "width", int32).node_property(@product, "height", int32);
insert().into(@product).nodes([{_id:"product1", price:50, weight:160, width:20, height:152}, {_id:"product2", price:42, weight:90, width:30, height:90}, {_id:"product3", price:24, weight:50, width:55, height:70}, {_id:"product4", price:38, weight:20, width:32, height:66}]);
Creating HDC Graph
To load the entire graph to the HDC server hdc-server-1 as my_hdc_graph:
CREATE HDC GRAPH my_hdc_graph ON "hdc-server-1" OPTIONS {
  nodes: {"*": ["*"]},
  edges: {"*": ["*"]},
  direction: "undirected",
  load_id: true,
  update: "static"
}
hdc.graph.create("my_hdc_graph", {
  nodes: {"*": ["*"]},
  edges: {"*": ["*"]},
  direction: "undirected",
  load_id: true,
  update: "static"
}).to("hdc-server-1")
Parameters
Algorithm name: similarity
| Name | Type | Spec | Default | Optional | Description | |
|---|---|---|---|---|---|---|
ids/uuids |
_id/_uuid |
Yes | Specifies the first group of nodes by their _id or _uuid. If unset, all nodes in the graph are used as the first group of nodes. |
The algorithm supports two calculation modes:
|
||
ids2/uuids2 |
_id/_uuid |
Yes | Specifies the second group of nodes for pairwise similarity by their _id or _uuid. If only ids2/uuids2 is set (and ids/uuids is not), the algorithm returns no result. |
|||
type |
String | pearson |
cosine |
No | Specifies the type of similarity to compute; for Pearson Correlation Coefficient, keep it as pearson. |
|
node_schema_property |
[]"<@schema.?><property>" |
No | Specifies numeric node properties to form a vector for each node; all specified properties must belong to the same label (schema). | |||
return_id_uuid |
String | uuid,id,both |
uuid |
Yes | Includes _uuid, _id, or both to represent nodes in the results. |
|
order |
String | asc,desc |
Yes | Sorts the results by similarity. |
||
limit |
Integer | ≥-1 | -1 |
Yes | Limits the number of results returned. Set to -1 to include all results. |
|
top_limit |
Integer | ≥-1 | -1 |
Yes | Limits the number of results returned for each node specified with ids/uuids in selection mode. Set to -1 to include all results with a similarity greater than 0. This parameter is invalid in pairing mode. |
|
File Writeback
CALL algo.similarity.write("my_hdc_graph", {
  return_id_uuid: "id",
  ids: "product1",
  ids2: ["product2", "product3", "product4"],
  node_schema_property: ["price", "weight", "width", "height"],
  type: "pearson"
}, {
  file: {
    filename: "pearson"
  }
})
algo(similarity).params({
  projection: "my_hdc_graph",
  return_id_uuid: "id",
  ids: "product1",
  ids2: ["product2", "product3", "product4"],
  node_schema_property: ["price", "weight", "width", "height"],
  type: "pearson"
}).write({
  file: {
    filename: "pearson"
  }
})
Result:
_id1,_id2,similarity
product1,product2,0.998785
product1,product3,0.474384
product1,product4,0.210494
Full Return
CALL algo.similarity.run("my_hdc_graph", {
  return_id_uuid: "id",
  ids: ["product1","product2"],
  ids2: ["product2","product3","product4"],
  node_schema_property: ["price", "weight", "width", "height"],
  type: "pearson"
}) YIELD p
RETURN p
exec{
  algo(similarity).params({
    return_id_uuid: "id",
    ids: ["product1","product2"],
    ids2: ["product2","product3","product4"],
    node_schema_property: ["price", "weight", "width", "height"],
    type: "pearson"
  }) as p
  return p
} on my_hdc_graph
Result:
| _id1 | _id2 | similarity |
|---|---|---|
| product1 | product2 | 0.998785 |
| product1 | product3 | 0.474384 |
| product1 | product4 | 0.210494 |
| product2 | product3 | 0.507838 |
| product2 | product4 | 0.253573 |
Stream Return
CALL algo.similarity.stream("my_hdc_graph", {
  return_id_uuid: "id",
  ids: ["product1", "product3"],
  node_schema_property: ["price", "weight", "width", "height"],
  type: "pearson",
  top_limit: 1
}) YIELD top
RETURN top
exec{
  algo(similarity).params({
    return_id_uuid: "id",
    ids: ["product1", "product3"],
    node_schema_property: ["price", "weight", "width", "height"],
    type: "pearson",
    top_limit: 1
  }).stream() as top
  return top
} on my_hdc_graph
Result:
| _id1 | _id2 | similarity |
|---|---|---|
| product1 | product2 | 0.998785 |
| product3 | product2 | 0.507838 |