
Overview
Closeness centrality of a node is measured by the average shortest distance from the node to all other reachable nodes. The closer a node is to all other nodes, the more central the node is. This algorithm is widely used in applications such as discovering key social nodes and finding best locations for functional places.
Closeness Centrality algorithm is best to be applied in connected graph. For disconnected graph, its variant, the Harmonic Centrality, is recommended.
Closeness centrality takes on values between 0 to 1, nodes with higher scores have shorter distances to all other nodes.
Closeness centrality was originally defined by Alex Bavelas in 1950:
- A. Bavelas, Communication patterns in task-oriented groups (1950)
Concepts
Shortest Distance
The shortest distance of two nodes is the number of edges contained in the shortest path between them. The shortest path is determined using the BFS principle, if node A is regarded as the start node and node B is one of the K-hop neighbors of node A, then K is the shortest distance between A and B. Please read K-Hop All for the details about BFS and K-hop neighbor.
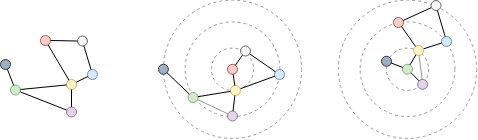
Examine the shortest distance between the red and green nodes in the above graph. Since the graph is undirected, no matter which node (red or green) to start, the other node is the 2-hop neighbor. Thus, the shortest distance between them is 2.
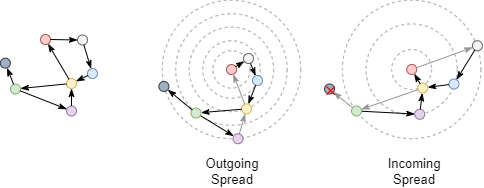
Examine the shortest distance between the red and green nodes after converting the undirected graph to directed graph, the edge direction should be considered now. The outgoing shortest distance from the red node to the green node is 4, and the incoming shortest distance from the green node to the red node is 3.
When edge weights are considered, the shortest distance between two nodes is the least sum of weights of the edges in the path between them.
Examine the shortest distance between the red and green nodes after assigning weights to edges. To minimize the total weight, a path with more edges is chosen, resulting in a total weight of 5.

Closeness Centrality
Closeness centrality score of a node defined by this algorithm is the inverse of the arithmetic mean of the shortest distances from the node to all other reachable nodes. The formula is:
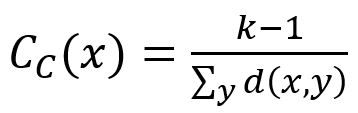
where x is the target node, y is any node that connects with x along edges (x itself is excluded), k-1 is the number of y, d(x,y) is the shortest distance between x and y.
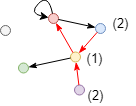
Calculate closeness centrality score of the red node in the incoming direction in the graph above. Only the blue, yellow and purple nodes can reach the red node in this direction, so the score is 3 / (2 + 1 + 2) = 0.6. Since the green and grey nodes cannot reach the red node in the incoming direction, they are not included in the calculation.
Closeness Centrality algorithm consumes considerable computing resources. For a graph with V nodes, it is recommended to perform (uniform) sampling when V > 10,000, and the suggested number of samples is the base-10 logarithm of the number of nodes (
log(V)).
For each execution of the algorithm, sampling is performed only once, centrality score of each node is computed based on the shortest distance between the node and all sample nodes.
Considerations
- The closeness centrality score of isolated nodes is 0.
- When computing closeness centrality for a node, the unreachable nodes are excluded. For example, this includes isolated nodes, nodes in other connected components, or nodes within the same connected component that are unreachable in the specified direction.
Example Graph
Run the following statements on an empty graph to define its structure and insert data:
ALTER GRAPH CURRENT_GRAPH ADD NODE {
user ()
};
ALTER GRAPH CURRENT_GRAPH ADD EDGE {
vote ()-[{strength uint32}]->()
};
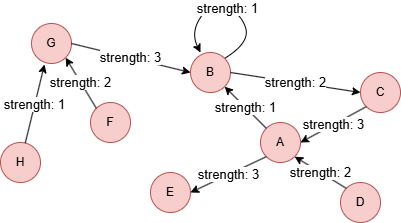
INSERT (A:user {_id: "A"}),
(B:user {_id: "B"}),
(C:user {_id: "C"}),
(D:user {_id: "D"}),
(E:user {_id: "E"}),
(F:user {_id: "F"}),
(G:user {_id: "G"}),
(H:user {_id: "H"}),
(A)-[:vote {strength: 1}]->(B),
(A)-[:vote {strength: 3}]->(E),
(B)-[:vote {strength: 1}]->(B),
(B)-[:vote {strength: 2}]->(C),
(C)-[:vote {strength: 3}]->(A),
(D)-[:vote {strength: 2}]->(A),
(F)-[:vote {strength: 2}]->(G),
(G)-[:vote {strength: 3}]->(B),
(H)-[:vote {strength: 1}]->(G);
create().node_schema("user").edge_schema("vote");
create().edge_property(@vote, "strength", uint32);
insert().into(@user).nodes([{_id:"A"},{_id:"B"},{_id:"C"},{_id:"D"},{_id:"E"},{_id:"F"},{_id:"G"},{_id:"H"}]);
insert().into(@vote).edges([{_from:"A", _to:"B", strength:1}, {_from:"A", _to:"E", strength:3}, {_from:"B", _to:"B", strength:1}, {_from:"B", _to:"C", strength:2}, {_from:"C", _to:"A", strength:3}, {_from:"D", _to:"A", strength:2}, {_from:"F", _to:"G", strength:2}, {_from:"G", _to:"B", strength:3}, {_from:"H", _to:"G", strength:1}]);
Running on HDC Graphs
Creating HDC Graph
To load the entire graph to the HDC server hdc-server-1 as my_hdc_graph:
CREATE HDC GRAPH my_hdc_graph ON "hdc-server-1" OPTIONS {
  nodes: {"*": ["*"]},
  edges: {"*": ["*"]},
  direction: "undirected",
  load_id: true,
  update: "static"
}
hdc.graph.create("my_hdc_graph", {
  nodes: {"*": ["*"]},
  edges: {"*": ["*"]},
  direction: "undirected",
  load_id: true,
  update: "static"
}).to("hdc-server-1")
Parameters
Algorithm name: closeness_centrality
Name |
Type |
Spec |
Default |
Optional |
Description |
|---|---|---|---|---|---|
ids |
[]_id |
/ | / | Yes | Specifies nodes for computation by their _id. If unset, computation includes all nodes. |
uuids |
[]_uuid |
/ | / | Yes | Specifies nodes for computation by their _uuid. If unset, computation includes all nodes. |
direction |
String | in, out |
/ | Yes | Specifies that all edges in the shortest paths must be either incoming (in) or outgoing (out). |
edge_schema_property |
[]"<@schema.?><property>" |
/ | / | Yes | Specifies numeric edge properties used as weights by summing their values. Only properties of numeric type are considered, and edges without these properties are ignored. |
impl_type |
String | dijkstra, delta_stepping, spfa, beta |
beta |
Yes | Specifies the algorithm used to compute weighted shortest paths: Dijkstra, Delta-Stepping, SPFA, or the default (beta) Ultipa algorithm. Valid only when edge_schema_property is specified. |
sample_size |
Integer | -1, -2, [1, |V|] |
-2 |
Yes | Specifies the sampling strategy for computation:
|
return_id_uuid |
String | uuid, id, both |
uuid |
Yes | Includes _uuid, _id, or both in the results to represent nodes. |
limit |
Integer | ≥-1 | -1 |
Yes | Limits the number of results returned. Set to -1 to include all results. |
order |
String | asc, desc |
/ | Yes | Sorts the results by closeness_centrality. |
File Writeback
CALL algo.closeness_centrality.write("my_hdc_graph", {
  return_id_uuid: "id"
}, {
  file: {
    filename: "closeness"
  }
})
algo(closeness_centrality).params({
  projection: "my_hdc_graph",
  return_id_uuid: "id"
}).write({
  file: {
    filename: "closeness"
  }
})
Result:
_id,closeness_centrality
A,0.583333
E,0.388889
C,0.5
G,0.538462
D,0.388889
F,0.368421
H,0.368421
B,0.636364
DB Writeback
Writes the closeness_centrality values from the results to the specified node property. The property type is float.
CALL algo.closeness_centrality.write("my_hdc_graph", {},
{
  db: {
    property: "cc"
  }
})
algo(closeness_centrality).params({
  projection: "my_hdc_graph"
}).write({
  db:{
    property: 'cc'
  }
})
Full Return
CALL algo.closeness_centrality.run("my_hdc_graph", {
  return_id_uuid: "id",
  ids: ["A", "B"],
  edge_schema_property: "strength"
}) YIELD cc
RETURN cc
exec{
  algo(closeness_centrality).params({
    return_id_uuid: "id",
    ids: ["A", "B"],
    edge_schema_property: "strength"
  }) as cc
  return cc
} on my_hdc_graph
Result:
| _id | closeness_centrality |
|---|---|
| A | 0.291667 |
| B | 0.318182 |
Stream Return
CALL algo.closeness_centrality.stream("my_hdc_graph", {
  return_id_uuid: "id",
  direction : "out",
  order: "desc",
  sample_size: -2
}) YIELD cc
FILTER cc.closeness_centrality > 0.5
RETURN cc
exec{
  algo(closeness_centrality).params({
    return_id_uuid: "id",
    direction : "out",
    order: "desc",
    sample_size: -2
  }).stream() as cc
  where cc.closeness_centrality > 0.5
  return cc
} on my_hdc_graph
Result:
| _id | closeness_centrality |
|---|---|
| A | 0.75 |
| C | 0.6 |
Running on Distributed Projections
Creating Distributed Projection
To project the entire graph to its shard servers as myProj:
CREATE PROJECTION myProj OPTIONS {
  nodes: {"*": ["*"]},
  edges: {"*": ["*"]},
  direction: "undirected",
  load_id: true
}
create().projection("myProj", {
  nodes: {"*": ["*"]},
  edges: {"*": ["*"]},
  direction: "undirected",
  load_id: true
})
Parameters
Algorithm name: closeness_centrality
Name |
Type |
Spec |
Default |
Optional |
Description |
|---|---|---|---|---|---|
direction |
String | in, out |
/ | Yes | Specifies that the shortest paths should only contain incoming edges (in) or outgoing edges (out). |
sample_rate |
Float | (0, 1] | 1 | Yes | Specifies the proportion of edges to sample for computation. |
limit |
Integer | ≥-1 | -1 |
Yes | Limits the number of results returned; -1 includes all results. |
order |
String | asc, desc |
/ | Yes | Sorts the results by closeness_centrality. |
File Writeback
CALL algo.closeness_centrality.write("myProj", {},
{
  file: {
    filename: "closeness"
  }
})
algo(closeness_centrality).params({
  projection: "myProj"
}).write({
  file: {
    filename: "closeness"
  }
})
Result:
_id,closeness_centrality
H,0.368421052631579
F,0.368421052631579
E,0.388888888888889
D,0.388888888888889
B,0.636363636363636
A,0.583333333333333
G,0.538461538461538
C,0.5
DB Writeback
Writes the closeness_centrality values from the results to the specified node property. The property type is double.
CALL algo.closeness_centrality.write("myProj", {},
{
  db: {
    property: "cc"
  }
})
algo(closeness_centrality).params({
  projection: "myProj"
}).write({
  db:{
    property: 'cc'
  }
})