Overview
Ultipa Manager displays results in the Result Views under UQL Editor after running UQL:
Ultipa Manager presents results in List Mode or Graph Mode. The default display mode for different kinds of results is different, for example, list is used by default for results of node/edge queries, and graph is default for path queries. You can use the Graph/List Switcher in the upper left corner of the result views to switch.
List Mode
Node List
Below is a list generated by a node query, nodes of different schemas are displayed in separated lists:
Click the Edit or Delete icon in the Ops column to edit or delete node:
Edge List
Below is a list generated by an edge query, edges of different schemas are displayed in separated lists:
Click the Edit or Delete icon in the Ops column to edit or delete edge. Node Selector is provided to change the start node or end node of edge, node can be found and selected if you type in the UUID of node:
After clicking the Search icon in Node Selector, you can search for node by other conditions. The placeholder is {name=="ultipa"}
, you can modify the filtering condition in the curly brace and press Enter key to search, and click any result to select the node:
Ultipa Manager has some limitation on the number of search results and it is 100 results the maximum. (It may vary due to different versions.)
Path List
Below is a list generated by a path query, each path is represented by a sequence, a sequence that starts with a node, ends with a node and alternate between nodes and edges. Click a Node Label or an Edge Label, you can see the Edit and Delete icons:
The node and edge labels can be specified in Settings - Configuration - Node Label Property Name and Settings - Configuration - Edge Label Property Name:
If the node or edge has the specified label (property) respectively, value of the property is shown with the name of schema, otherwise only display the schema name.
Other Lists
If the types of results are ATTR (atomic data without internal structure, such as string, number), TABLE, ARRAY, etc., the result list is not editable.
Graph Mode
Graph mode displays results in 2D or 3D graph, which can be more intuitive than list. Graph mode supports creating/editing/deleting metadata, adjusting metadata display text (label), customizing style, doing further searches in the current result, and so on.
Switch 2D/3D View
2D view is used by default in graph mode:
Click the 2D/3D View switcher in the upper right corner of the result views to switch to the 3D view:
In 3D view, node and edge labels are hidden by default, you can choose to show them by the Node Label and Edge Label switchers in the upper right corner of the view. In addition, 3D view shows a combined edge if there exists multiple edges between two nodes, and that combined edge is bi-directional in case the original edges are of two directions.
Styling
In 2D view, the default style for nodes and edges is as follows, with nodes as blue circles and edges as thin blue lines with arrows:
Click the Palettes icon in the upper right corner of the result views, change to another created style or create new style:
Click Add to open the Style Editor:
- Fill in the custom style name at the top
- Click the + icon on the left to create sub-style: Enter the sub-style name, choose the type of the style as node or edge, click Submit to save
- Edit sub-style:
- Check the src and/or dest to limit the style only to be applied on the source and/or destination nodes; sub-style of edge does not have this setting
- Click Add filtering rule to add rule(s); all rules have to be met to apply this sub-style; support to filter by schema and property as follows:
- Enter
_schema
to filter by schema - Enter property name to filter by property, such as
level
- Enter in format
@schema.property
to filter by schema and property, such as@customer.level
- Enter
- Set the style: node style includes Size, Color and Shape (icon is also supported), edge style includes Line Width and Color; use the Display dropdown to specify the property to be used as label, and uncheck Display Schema if you want to remove the schema name in the label as it is checked by default
Sub-styles node-default and edge-default are created by default and cannot be deleted, they do not support any filtering rules, but you may adjust its displaying style and labels. After adding all the sub-styles as needed, click Submit to save the style.
When a style contains multiple sub-styles, the sub-styles in front have greater priority than those that are behind, you can change the order of sub-styles simply by dragging and dropping the their names.
The style just saved will not be applied to the graph immediately, you need to manually switch, sometimes the UQL has to be re-executed.
Styling settings in 3D view are relatively limited, you may use the same way described above to adjust the color and label of nodes and edges. The styles are shared between 3D and 2D views.
Operations on Node
Ultipa Manager supports the following mouse or trackpad operations against nodes in the graph:
Hover | Drag and Drop | Left Click | Right Click | |
---|---|---|---|---|
2D View | Show node information at the bottom of the pane | Move node and lock the node | Lock the node, lock the node information at the bottom of the pane until clicks elsewhere, and the left-click menu pops up | The right-click menu pops up |
3D View | Show node label | Move node and it returns to the original position after dropping | The left-click menu pops up | / |
The left-click menu of node in 2D/3D view contains the following operations:
- Spread: Spread from the node, it is equivalent to executing UQL
spread().src(<current_node>).depth(N) limit M
, where depth (step)N
can be changed in Settings - Configuration - Depth, and the number of paths to returnM
can be changed in Settings - Configuration - Limit - Edit: Edit node properties, it is similar to the node editing in the list mode
- Delete: Delete node (and edges connected to the node)
Below is an example of Spread:
This is a 1-step spread, and it returns 3 paths, the settings under Settings - Configuration is:
Change the Limit to 5 and spread from that node again, anther 2 paths are returned:
The right-click menu of node in 2D view contains the following operations:
- Hide: Hide the node and edges connected to the node from the graph
- Lock: Lock the position of the node, and it will not move along with the move of other nodes
- Unlock: Unlock the node from the current position
- New Edge: Create an edge starting from the current node, a red dotted line would appear following the mouse, left-click another node (as the end node) or the blank place to bring out the create edge pop-up window, right-click to cancel the operation
Below is an example of New Edge, after selecting the end node, you need to add the information of edge schema and properties in the pop-up window. If the wanted end node is not shown in the graph, click the blank space and use the Node Selector to select end node in the pop-up window.
Operations on Edge
Ultipa Manager supports the following mouse or trackpad operations against edges in the graph:
Hover | Left Click | |
---|---|---|
2D View | Show edge information at the bottom of the pane | Lock the edge information at the bottom of the pane until clicks elsewhere, and the left-click menu pops up |
3D View | / | / |
The left-click menu of edge in 2D view contains the following operations:
- Edit: Edit edge properties, it is similar to the edge editing in the list mode
- Delete: Delete edge
Operations on Blank Space
Left Click | Right Click | Scroll | Left Click and Hold | Right Click and Hold | |
---|---|---|---|---|---|
2D View | Deselect node (if any) | The right-click menu pops up | Zoom | Pan | The right-click menu pops up |
3D View | / | / | Zoom | Rotate | Pan |
The right-click menu of the blank space in 2D view contains the following operations:
- New Node: Create a new node
- Lock All: Lock the positions of all nodes
- Unlock All: Unlock all nodes from the current positions
- Tree Layout: Rearrange all nodes in the tree layout
- Circular Layout: Rearrange all nodes in the circular layout
- Collapse/Expand Edges: Collapse/Merge multiple same-direction edges between two nodes into a single virtual edge, or expand/revert each merged virtual edge to multiple edges
Below is an example of Collapse/Expand Edges:
Locate Node
In 2D view, you use the Node Locator in the upper right corner of the result views to search for certain nodes and locate them in the graph:
In the dropdown menu, you can choose to search by UUID or Node Label. When UUID is used, Ultipa Manager would perform precise match; while using Node Label, it does fuzzy match. The property of Node Label can be specified in Settings - Configuration - Node Label Property Name.
Ultipa Manager centers the searched nodes and makes its border bolder:
Export Results
Ultipa Manager supports to export results in the formats of JSON, PNG and XLSX, you can click the Export Results icon in the upper right corner of the result views to do that. Export PNG option is greyed out in List mode, and some types of results are not supported to export in XLSX.
Result Views Management
Split Result Views
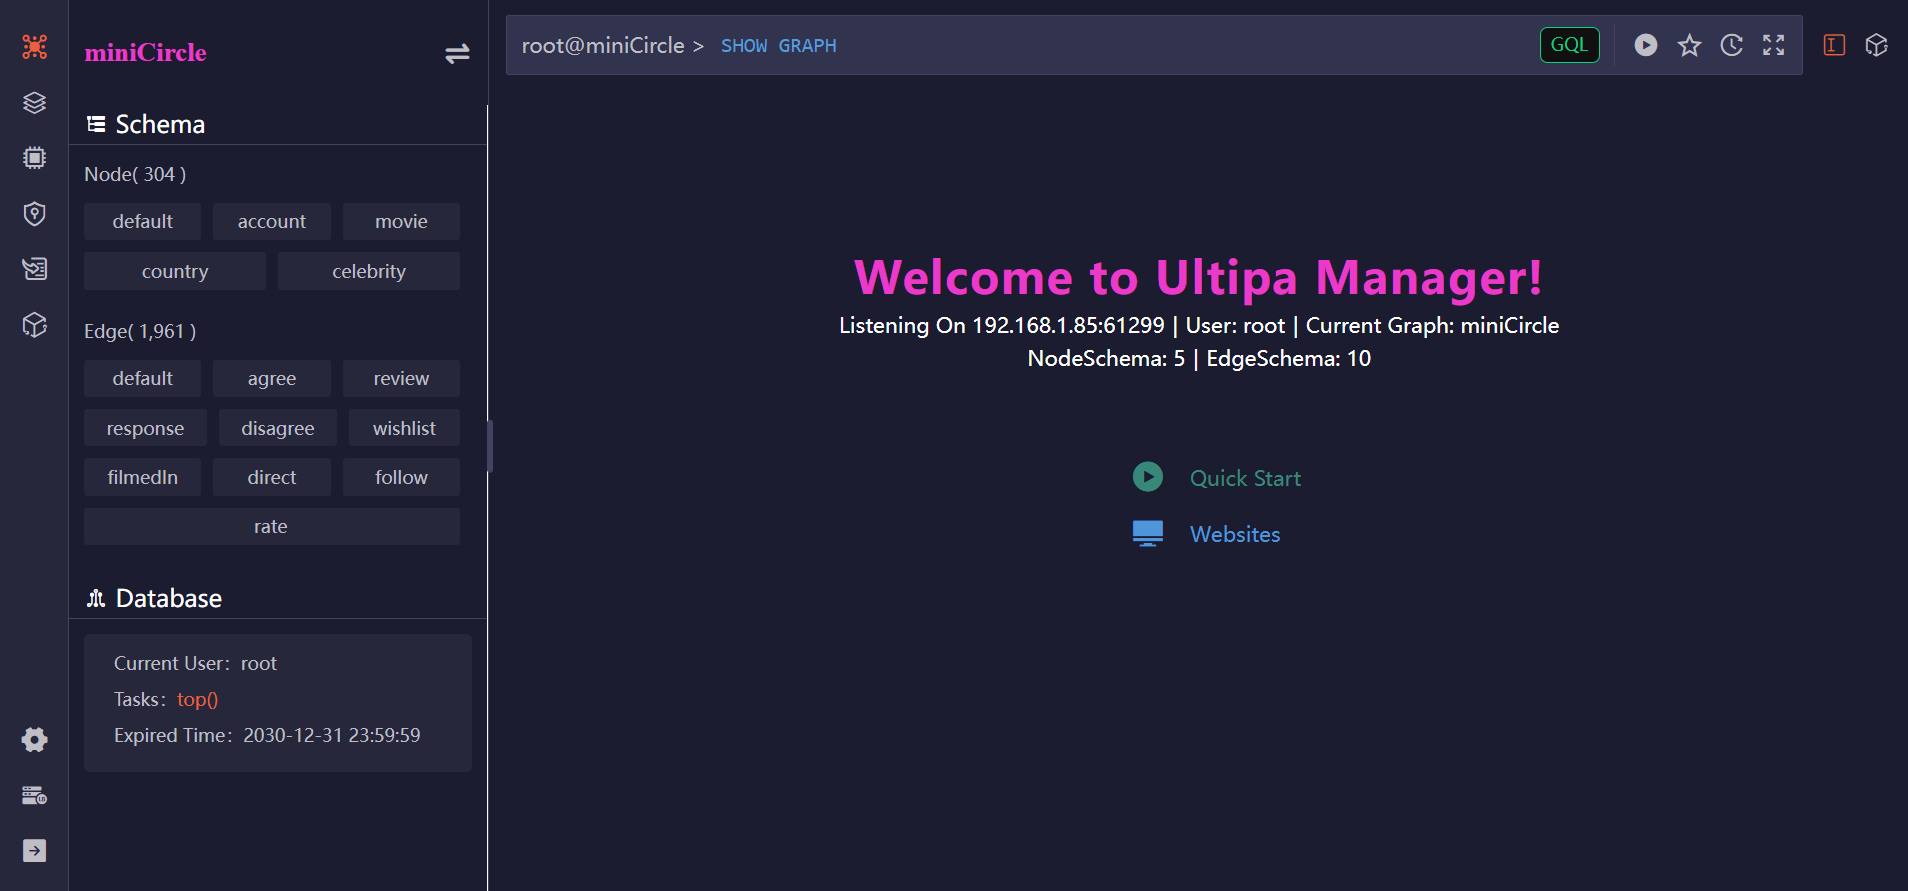
Click the Add Result View icon in the upper right corner of the result views to split result views, click the Close icon to close it. It is at most 4 result views to be kept at the same time, and Ultipa Manager Welcome page is shown when all result views are closed.
When there are more than one result views, the one highlighted with a blue border around it will be used to display the results of the next run of UQL. You can switch the active view by clicking any place in another view.
History Results
Each result view can keep the results of multiple UQL runs, click the tabs at the top to switch between different results.
Display Multiple Returns
When there are multiple return values of UQL, you can switch between different values by the return value tabs.