This article discusses what graph database is and the evaluation criteria to distinguish true graph databases from products built on other platforms.
What is Graph Database
In the previous article, we provided a detailed introduction to the characteristics of graph data. It is not difficult to see that graph data is a data format perfectly suited for expressing complex relationships between entities. Database systems specifically designed to store and process this type of graph data are called graph databases.
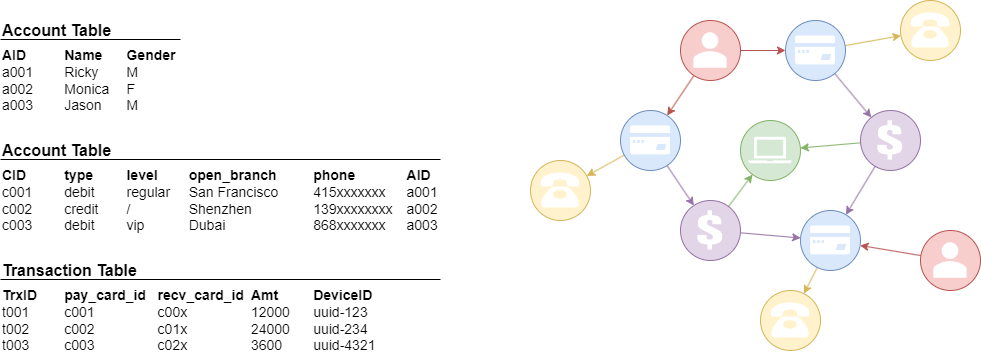
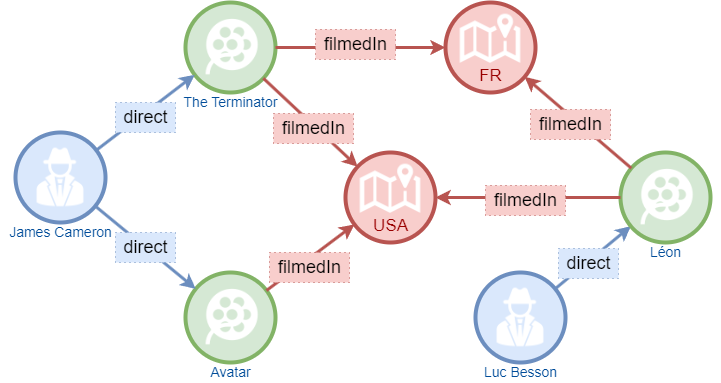
In a graph database, data is organized in the form of a graph, which includes nodes and edges. In this structure, nodes represent entities, while edges depict the relationships between nodes.
Therefore, a graph database is not just a form of data storage; it is also a powerful tool for data processing and analysis. It provides efficient and flexible solutions for various complex relationship data.
How to Evaluate a Graph Database
In addition to meeting the basic requirements of general databases, such as ACID transactions, scalability, and security, graph databases also need to fulfill certain specific criteria.
Native Graph Storage
Native Graph Storage refers to a database storage engine that has been specifically designed and optimized to efficiently store and manage nodes and edges in a graph. This design caters to the performance requirements of complex queries and analyses, such as traversals, path finding, and graph algorithms.
A native graph storage engine is tailored for handling node and edge data rather than reusing tabular storage from relational databases. Consequently, native graph storage engines typically incorporate unique data structures and algorithms.

It's important to note that not all 'graph database' products are truly native graph databases. Generally, products built on relational databases, NoSQL databases (such as key-value stores, document databases), and similar platforms that implement graph computation features, graph processing frameworks, or graph libraries through extended functionality or plugins, may not fully adhere to the standards of native graph storage in their internal implementations. As a result, they often exhibit significant disparities in query performance and flexibility when compared to true graph databases.
Correctness of Algorithms
In addition to addressing challenges related to issues such as distribution, concurrent operations, and transaction mechanisms, graph databases must ensure the accuracy of their graph queries and graph algorithm computations.
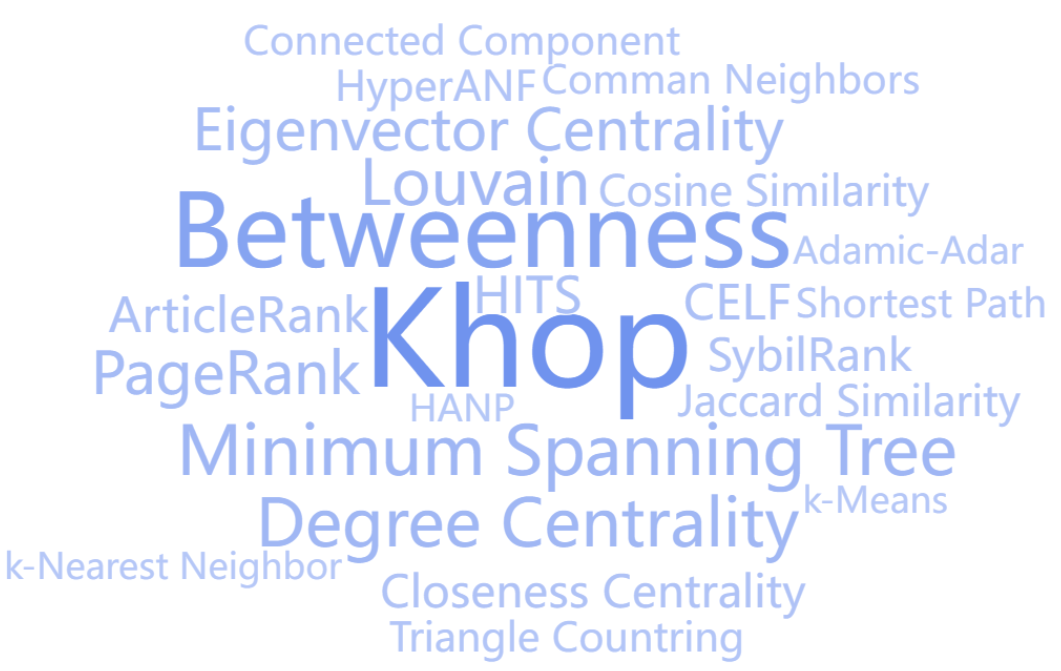
The graph algorithms supported by graph databases, such as shortest paths, k-hop neighbors, connectivity measurement, community detection, etc., involve highly complex internal implementations. Moreover, graph structures can involve various boundary conditions, such as loops, isolated nodes, etc. Handling these situations requires specialized algorithmic support. Improper handling of these cases might lead to computational errors.

The correctness of graph algorithms needs to be ensured through meticulous algorithm design and rigorous algorithm testing. Additionally, the computational capabilities of the graph database engine itself must continuously improve to guarantee the accuracy of computational results in various complex scenarios.
Visualization of Query Results
In addition to basic operations such as visualizing graph modeling, data import, algorithm execution, and user management, graph databases should pay special attention to enhancing the visualization capabilities of query results.
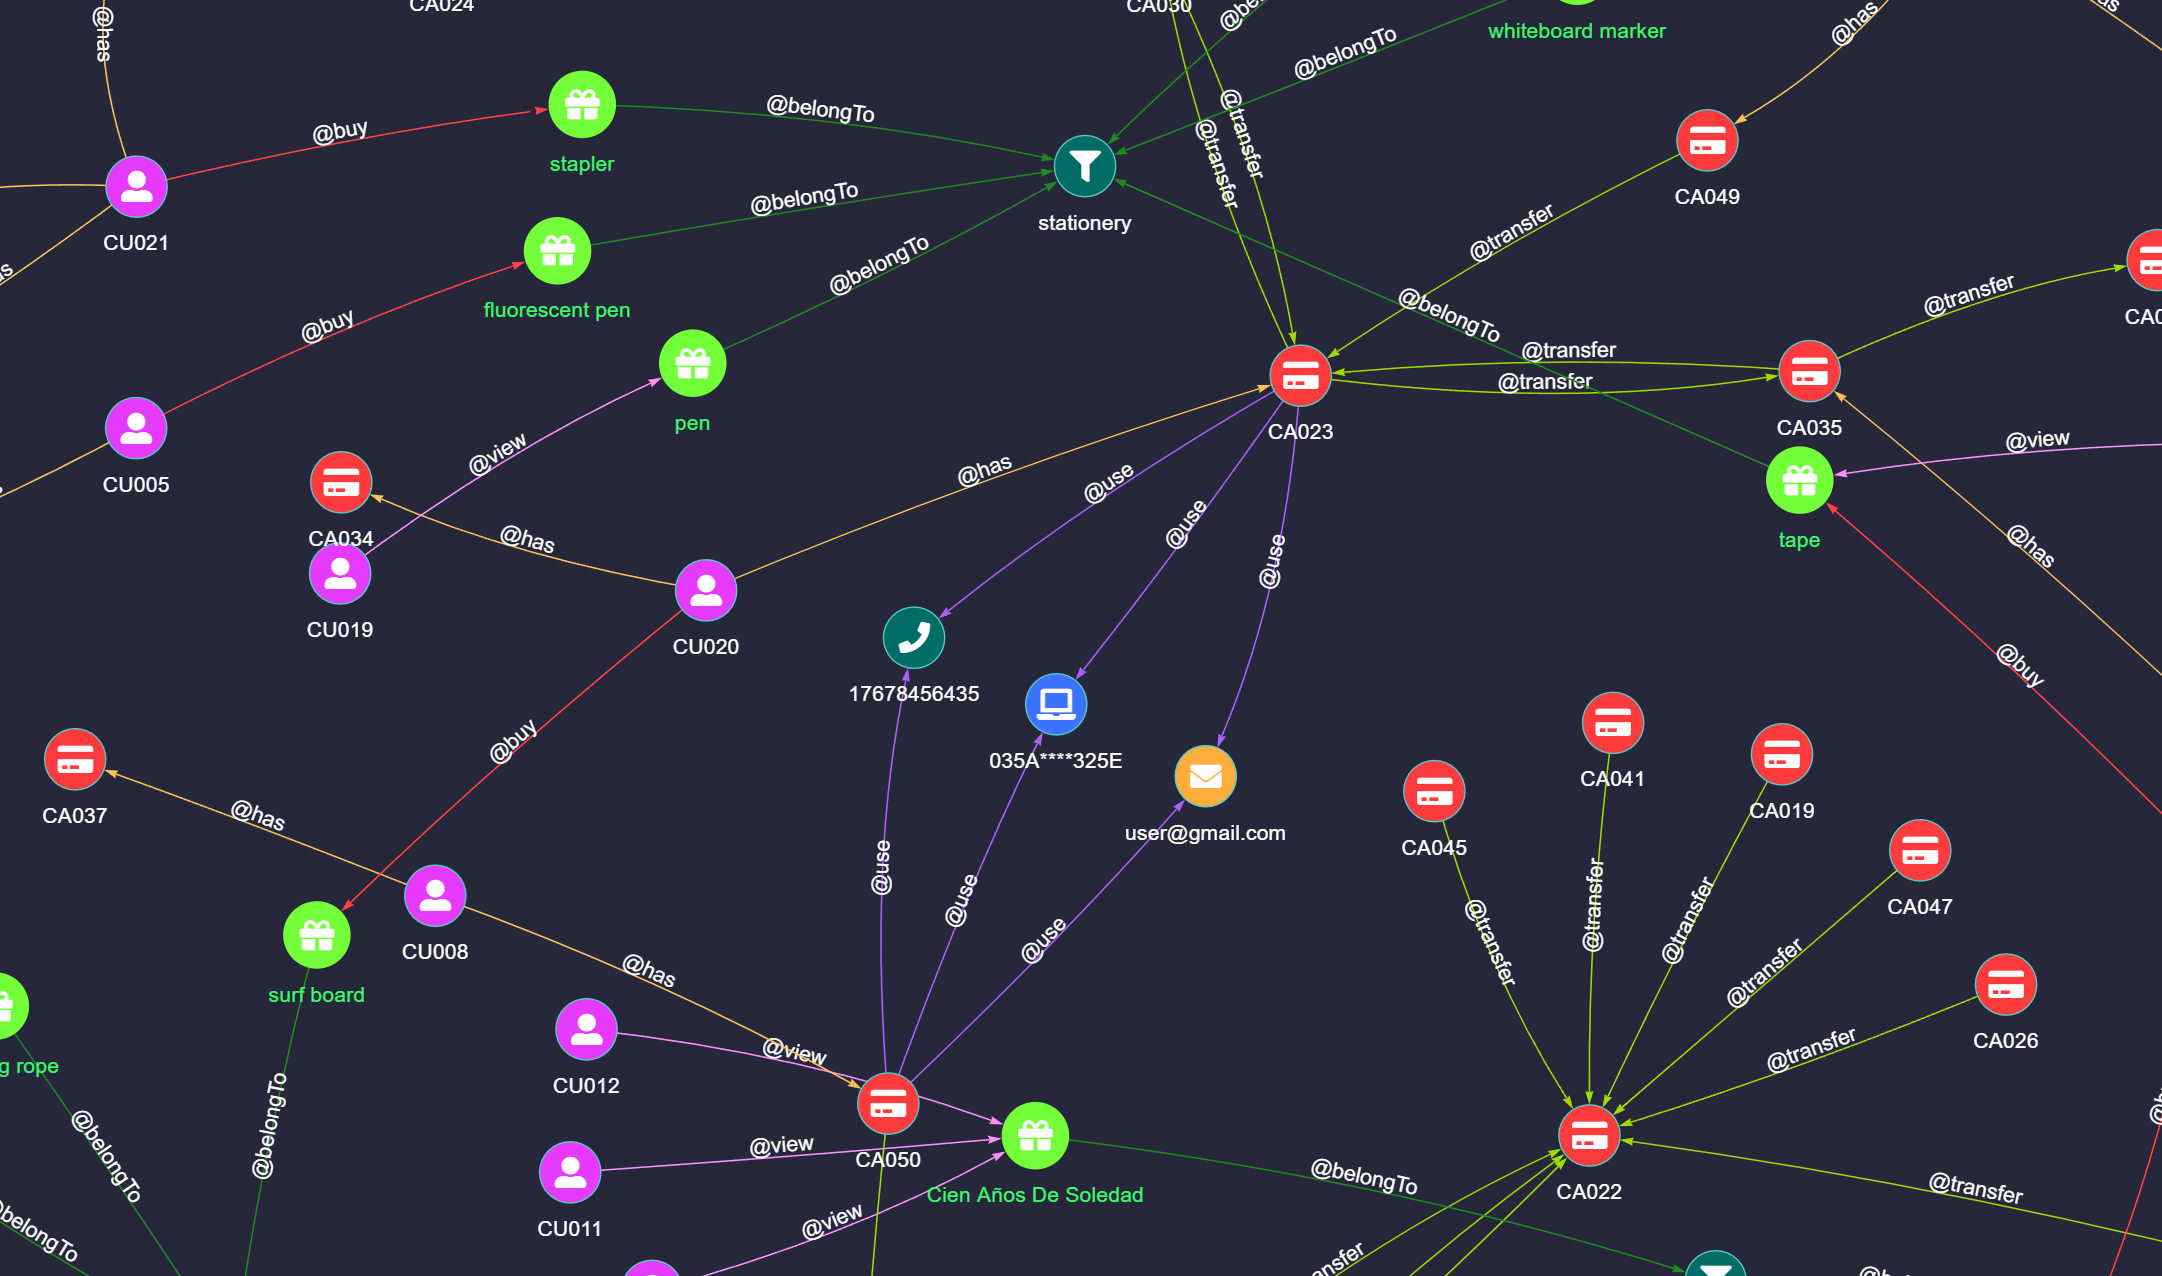
Graph data itself is a higher-dimensional data form compared to traditional tables. The human brain's intuitive perception and processing speed for high-dimensional data naturally surpass that of machines. Therefore, the true value of a graph database lies in its ability to present computational results in a graphical format, enabling people to gain intuitive insights into the data.
A graph database should be capable of presenting query or analysis results in the form of 2D or 3D graphs, where nodes can be represented using shapes or icons, and edges can be depicted using lines or arrows. Different colors, sizes, and shapes of nodes and edges can convey diverse information, assisting users in a more intuitive understanding and analysis of the data. This visualization capability not only enhances users' comprehension of the data but also makes it easier to discover and analyze complex relationships and patterns.


