Pearson Correlation Coefficient
✓ File Writeback ✕ Property Writeback ✓ Direct Return ✓ Stream Return ✕ Stats
Overview
The Pearson correlation coefficient is the most common way of measuring the strength and direction of the linear relationship between two quantitative variables. In the graph, nodes are quantified by N numeric properties (features) of them.
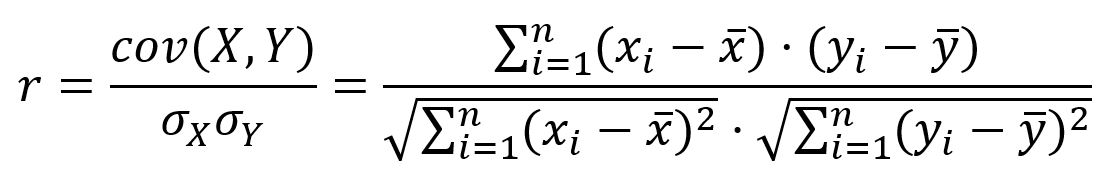
For two variables X= (x1, x2, ..., xn) and Y = (y1, y2, ..., yn) , Pearson correlation coefficient (r) is defined as the ratio of the covariance of them and the product of their standard deviations:
The Pearson correlation coefficient ranges from -1 to 1:
Pearson correlation coefficient | Correlation type | Interpretation |
|---|---|---|
| 0 < r ≤ 1 | Positive correlation | As one variable becomes larger, the other variable becomes larger |
| r = 0 | No linear correlation | (May exist some other types of correlation) |
| -1 ≤ r < 0 | Negative correlation | As one variable becomes larger, the other variable becomes smaller |
Considerations
- Theoretically, the calculation of Pearson correlation coefficient between two nodes does not depend on their connectivity.
Syntax
- Command:
algo(similarity) - Parameters:
Name | Type | Spec | Default | Optional | Description |
|---|---|---|---|---|---|
| ids / uuids | []_id / []_uuid | / | / | No | ID/UUID of the first group of nodes to calculate |
| ids2 / uuids2 | []_id / []_uuid | / | / | Yes | ID/UUID of the second group of nodes to calculate |
| type | string | pearson | cosine | No | Type of similarity; for Pearson Correlation Coefficient, keep it as pearson |
| node_schema_property | []@<schema>?.<property> | Numeric type, must LTE | / | No | Specify two or more node properties to form the vectors, all properties must belong to the same (one) schema |
| limit | int | ≥-1 | -1 | Yes | Number of results to return, -1 to return all results |
| top_limit | int | ≥-1 | -1 | Yes | In the selection mode, limit the maximum number of results returned for each node specified in ids/uuids, -1 to return all results with similarity > 0; in the pairing mode, this parameter is invalid |
The algorithm has two calculation modes:
- Pairing: when both
ids/uuidsandids2/uuids2are configured, pairing each node inids/uuidswith each node inids2/uuids2(ignore the same node) and computing pair-wise similarities. - Selection: when only
ids/uuidsis configured, for each target node in it, computing pair-wise similarities between it and all other nodes in the graph. The returned results include all or limited number of nodes that have similarity > 0 with the target node and is ordered by the descending similarity.
Examples
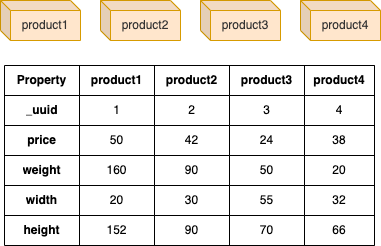
The example graph has 4 products (edges are ignored), each product has properties price, weight, weight and height:
File Writeback
| Spec | Content |
|---|---|
| filename | node1,node2,similarity |
UQLalgo(similarity).params({
  uuids: [1],
  uuids2: [2,3,4],
  node_schema_property: ['price', 'weight', 'width', 'height'],
  type: 'pearson'
}).write({
  file:{
    filename: 'pearson'
  }
})
Results: File pearson
Fileproduct1,product2,0.998785
product1,product3,0.474384
product1,product4,0.210494
UQLalgo(similarity).params({
  uuids: [1,2,3,4],
  node_schema_property: ['price', 'weight', 'width', 'height'],
  type: 'pearson'
}).write({
  file:{
    filename: 'list'
  }
})
Results: File list
Fileproduct1,product2,0.998785
product1,product3,0.474384
product1,product4,0.210494
product2,product1,0.998785
product2,product3,0.507838
product2,product4,0.253573
product3,product2,0.507838
product3,product1,0.474384
product3,product4,0.474021
product4,product3,0.474021
product4,product2,0.253573
product4,product1,0.210494
Direct Return
Alias Ordinal | Type | Description | Columns |
|---|---|---|---|
| 0 | []perNodePair | Node pair and its similarity | node1, node2, similarity |
UQLalgo(similarity).params({
  uuids: [1,2],
  uuids2: [2,3,4],
  node_schema_property: ['price', 'weight', 'width', 'height'],
  type: 'pearson'
}) as p
return p
Results: p
| node1 | node2 | similarity |
|---|---|---|
| 1 | 2 | 0.998785121601255 |
| 1 | 3 | 0.474383803132863 |
| 1 | 4 | 0.210494150169583 |
| 2 | 3 | 0.50783775659896 |
| 2 | 4 | 0.253573071269506 |
UQLalgo(similarity).params({
  uuids: [1,2],
  type: 'pearson',
  node_schema_property: ['price', 'weight', 'width', 'height'],
  top_limit: 1
}) as top
return top
Results: top
| node1 | node2 | similarity |
|---|---|---|
| 1 | 2 | 0.998785121601255 |
| 2 | 1 | 0.998785121601255 |
Stream Return
Alias Ordinal | Type | Description | Columns |
|---|---|---|---|
| 0 | []perNodePair | Node pair and its similarity | node1, node2, similarity |
UQLalgo(similarity).params({
  uuids: [3],
  uuids2: [1,2,4],
  node_schema_property: ['@product.price', '@product.weight', '@product.width'],
  type: 'pearson'
}).stream() as p
where p.similarity > 0
return p
Results: p
| node1 | node2 | similarity |
|---|---|---|
| 3 | 1 | 0.167101674410905 |
| 3 | 2 | 0.181677473801374 |
UQLalgo(similarity).params({
  uuids: [1,3],
  node_schema_property: ['price', 'weight', 'width', 'height'],
  type: 'pearson',
  top_limit: 1
}).stream() as top
return top
Results: top
| node1 | node2 | similarity |
|---|---|---|
| 1 | 2 | 0.998785121601255 |
| 3 | 2 | 0.50783775659896 |