Betweenness Centrality
✓ File Writeback ✓ Property Writeback ✓ Direct Return ✓ Stream Return ✕ Stats
Overview
Betweenness centrality measures the probability that a node lies in the shortest paths between any other two nodes. Proposed by Linton C. Freeman in 1977, this algorithm effectively detects the 'bridge' or 'medium' nodes between multiple parts of the graph.
Betweenness centrality takes on values between 0 to 1, nodes with larger scores have stronger impact on the flow or connectivity of the network.
Related materials are as below:
- L.C. Freeman, A Set of Measures of Centrality Based on Betweenness (1977)
- L.C. Freeman, Centrality in Social Networks Conceptual Clarification (1978)
Concepts
Shortest Path
For every pair of nodes in a connected graph, there exists at least one shortest path between the two nodes such that either the number of edges that the path passes through (for unweighted graphs) or the sum of the weights of the edges (for weighted graphs) is minimized.
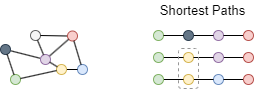
In the unweighted graph above, we can find three shortest paths between the red and green nodes, and two of them contain the yellow node, so the probability that the yellow node lies in the shortest paths of the red-green node pair is 2 / 3 = 0.6667.
Betweenness Centrality
Betweenness centrality score of a node is defined by this formula:
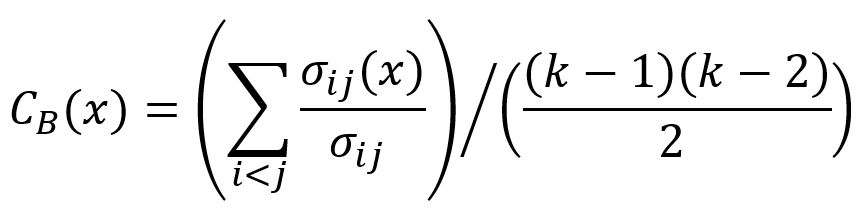
where x is the target node, i and j are two distinct nodes in the graph (x itself is excluded), σ is the number of shortest paths of pair ij, σ(x) is the number of shortest paths of pair ij that pass through x, σ(x)/σ is the probability that x lies in the shortest paths of pair ij (which is 0 if i and j are not connected), k is the number of nodes in the graph, (k-1)(k-2)/2 is the number of ij node pairs.
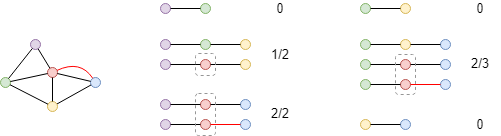
Calculate betweenness centrality of the red node in this graph. There are 5 nodes in total, thus (5-1)*(5-2)/2 = 6 node pairs except the red node, the probabilities that the red node lies in the shortest paths between all node pairs are 0, 1/2, 2/2, 0, 2/3 and 0 respectively, so its betweenness centrality score is (0 + 1/2 + 2/2 + 0 + 2/3 + 0) / 6 = 0.3611.
NOTEBetweenness Centrality algorithm consumes considerable computing resources. For a graph with V nodes, it is recommended to perform (uniform) sampling when V > 10,000, and the suggested number of samples is the base-10 logarithm of the number of nodes (
log(V)).
For each execution of the algorithm, sampling is performed only once, centrality scores of all nodes are computed based on the shortest paths between all sample nodes.
Considerations
- The betweenness centrality score of isolated nodes is 0.
- The Betweenness Centrality algorithm ignores the direction of edges but calculates them as undirected edges. In undirected graph of
knodes, there are(k-1)(k-2)/2node pairs for each target node.
Syntax
- Command:
algo(betweenness_centrality) - Parameters:
Name | Type | Spec | Default | Optional | >Description |
|---|---|---|---|---|---|
| sample_size | int | -1, -2, [1, V] | -2 | Yes | Number of samples to compute centrality scores; -1 means to sample log(V) nodes; -2 means not to perform sampling; a number within [1, V] means to sample the set number of nodes |
| limit | int | ≥-1 | -1 | Yes | Number of results to return, -1 to return all results |
| order | string | asc, desc | / | Yes | Sort nodes by the centrality score |
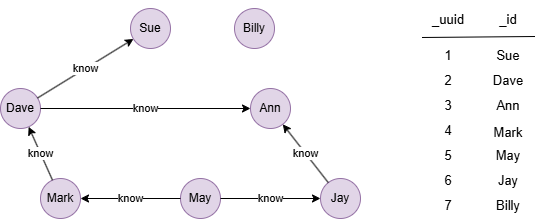
Examples
The example graph is a small social network, nodes represent users, and edges represent the relationship of know:
File Writeback
| Spec | Content |
|---|---|
| filename | _id,centrality |
UQLalgo(betweenness_centrality).params().write({
  file:{
    filename: 'centrality'
  }
})
Results: File centrality
FileBilly,0
Jay,0.0666667
May,0.0666667
Mark,0.133333
Ann,0.133333
Dave,0.333333
Sue,0
Property Writeback
| Spec | Content | Write to | Data Type |
|---|---|---|---|
| property | centrality | Node property | float |
UQLalgo(betweenness_centrality).params().write({
  db:{
    property: 'bc'
  }
})
Results: Centrality score for each node is written to a new property named bc
Direct Return
| Alias Ordinal | Type | Description | Column Name |
|---|---|---|---|
| 0 | []perNode | Node and its centrality | _uuid, centrality |
UQLalgo(betweenness_centrality).params({
  order: 'desc',
  limit: 3
}) as bc
return bc
Results: bc
| _uuid | centrality |
|---|---|
| 2 | 0.33333299 |
| 4 | 0.13333300 |
| 3 | 0.13333300 |
Stream Return
| Alias Ordinal | Type | Description | Column Name |
|---|---|---|---|
| 0 | []perNode | Node and its centrality | _uuid, centrality |
UQLalgo(betweenness_centrality).params().stream() as bc
where bc.centrality == 0
return count(bc)
Results: 2