p-Cohesion
✓ File Writeback ✕ Property Writeback ✕ Direct Return ✕ Stream Return ✓ Stats
Overview
The p-Cohesion algorithm identifies groups of network players (nodes) that are highly connected with each other, represented by cohesive subgraphs. It provides valuable insights into the level of connectivity and interdependence within these groups, enabling in-depth analysis of the graph structure and its implications.
The concept of p-cohesion was first proposed by S. Morris in a contagion model of the interaction among large populations:
- S. Morris, Contagion. The Review of Economic Studies, 67(1), 57–78 (2000)
Concepts
p-Cohesion
One natural measure of the 'cohesion' of a group is the relative frequency of ties among group members compared to non-members. Let the cohesion be a constant p ∈ (0,1), a p-cohesion is a connected subgraph in which every node has, at least, a proportion p of its neighbors within the subgraph, i.e., at most, a proportion (1 − p) of its neighbors outside.
The p-Cohesion model offers two distinct advantages compared to other cohesive subgraph models:
- With a large p value, a p-cohesion ensures not only inner-cohesiveness, but also outer-sparseness.
- In many scenarios, considering the percentage of neighbors rather than a fixed number of neighbors (such as the k value in k-Core) is more appropriate due to variations in node degrees.
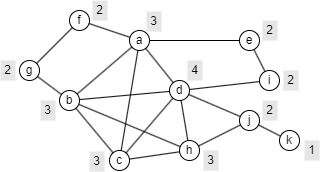
Below shows an example graph. Suppose p = 0.6, a grey label is put next to each node indicating the smallest number of neighbors required for the node to stay in a p-cohesion.
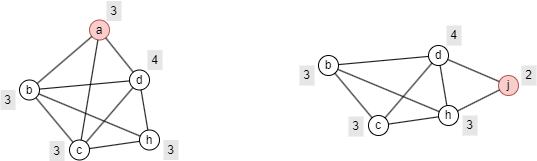
Below are the minimal (in terms of the number of nodes) p-cohesion subgraphs including node a and node j respectively.
Ultipa's p-Cohesion algorithm finds the approximate minimal p-cohesion subgraph for each query node, and returns each subgraph in the form of its node set.
Considerations
- The p-Cohesion algorithm ignores the direction of edges but calculates them as undirected edges.
Syntax
- Command:
algo(p_cohesion) - Parameters:
Name | Type | Spec | Default | Optional | Description |
|---|---|---|---|---|---|
| ids / uuids | []_id / []_uuid | / | / | Yes | ID/UUID of the query nodes; find the approximate minimal p-cohesions that include each query node respectively; query all nodes if not set |
| p | float | (0,1) | / | No | Each node in a p-cohesion has at least a proportion p of its neighbors within the p-cohesion, and at most a proportion (1 − p) of its neighbors outside |
Examples
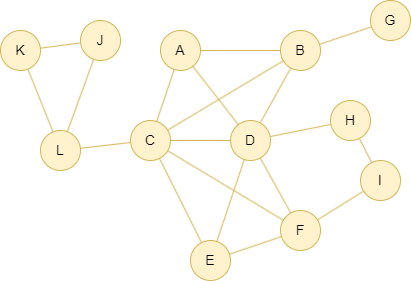
The example graph is as follows:
File Writeback
Spec | Content | Description |
|---|---|---|
| filename | subgraphN: _id,_id,... | Nodes that are contained in each p-cohesion subgraph |
UQLalgo(p_cohesion).params({
  ids: ['A', 'I'],
  p: 0.7
}).write({
  file: {
    filename: "cohesion"
  }
})
Statistics: num of subgraphs = 2
Results: File cohesion
Filesubgraph0:D,C,B,F,A,E,
subgraph1:D,C,F,B,H,E,A,I,