Change Password

Please enter the password.
Please enter the password. Between 8-64 characters. Not identical to your email address. Contain at least 3 of: uppercase, lowercase, numbers, and special characters.
Please enter the password.
Submit

Change Nickname

Current Nickname:
Submit

Apply New License

License Detail

Please complete this required field.

  • Ultipa Blaze (v4)

Standalone

Please complete this required field.

Please complete this required field.

Please complete this required field.

Please complete this required field.

Leave it blank if an HDC service is not required.

Please complete this required field.

Leave it blank if an HDC service is not required.

Please complete this required field.

Please complete this required field.

Mac addresses of all servers, separated by line break or comma.

Please complete this required field.

Please complete this required field.

Cancel
Apply
ID
Product
Status
Cores
Maximum Shard Services
Maximum Total Cores for Shard Service
Maximum HDC Services
Maximum Total Cores for HDC Service
Applied Validity Period(days)
Effective Date
Expired Date
Mac Address
Reason for Application
Review Comment
Close
Profile
  • Full Name:
  • Phone:
  • Company:
  • Company Email:
Change Password
Apply

You have no license application record.

Apply
Certificate Issued at Valid until Serial No. File
Serial No. Valid until File

Not having one? Apply now! >>>

Product Created On ID Amount (USD) Invoice

No Invoice

How to show fancy results in Manager

Answer this question
Resolved
chenliangyu2022-11-30

I tried to run UQL below in Ultipa Manager but there were no fancy results like I saw in your video, there was only a list of results. Any probably reasons why? Perhaps I didn’t find the way to switch 2D/3D visualization modes in Ultipa Manager?

find.()nodes()as nodes limit 10 return n{*}
resultsfancyManager

2 Answer(s)

  • 1 vote


    Check the screenshot above.

    apitlu 2022-11-30
    Add a comment...

    Discard
    Post
  • 2 vote

    Greetings from Ultipa!


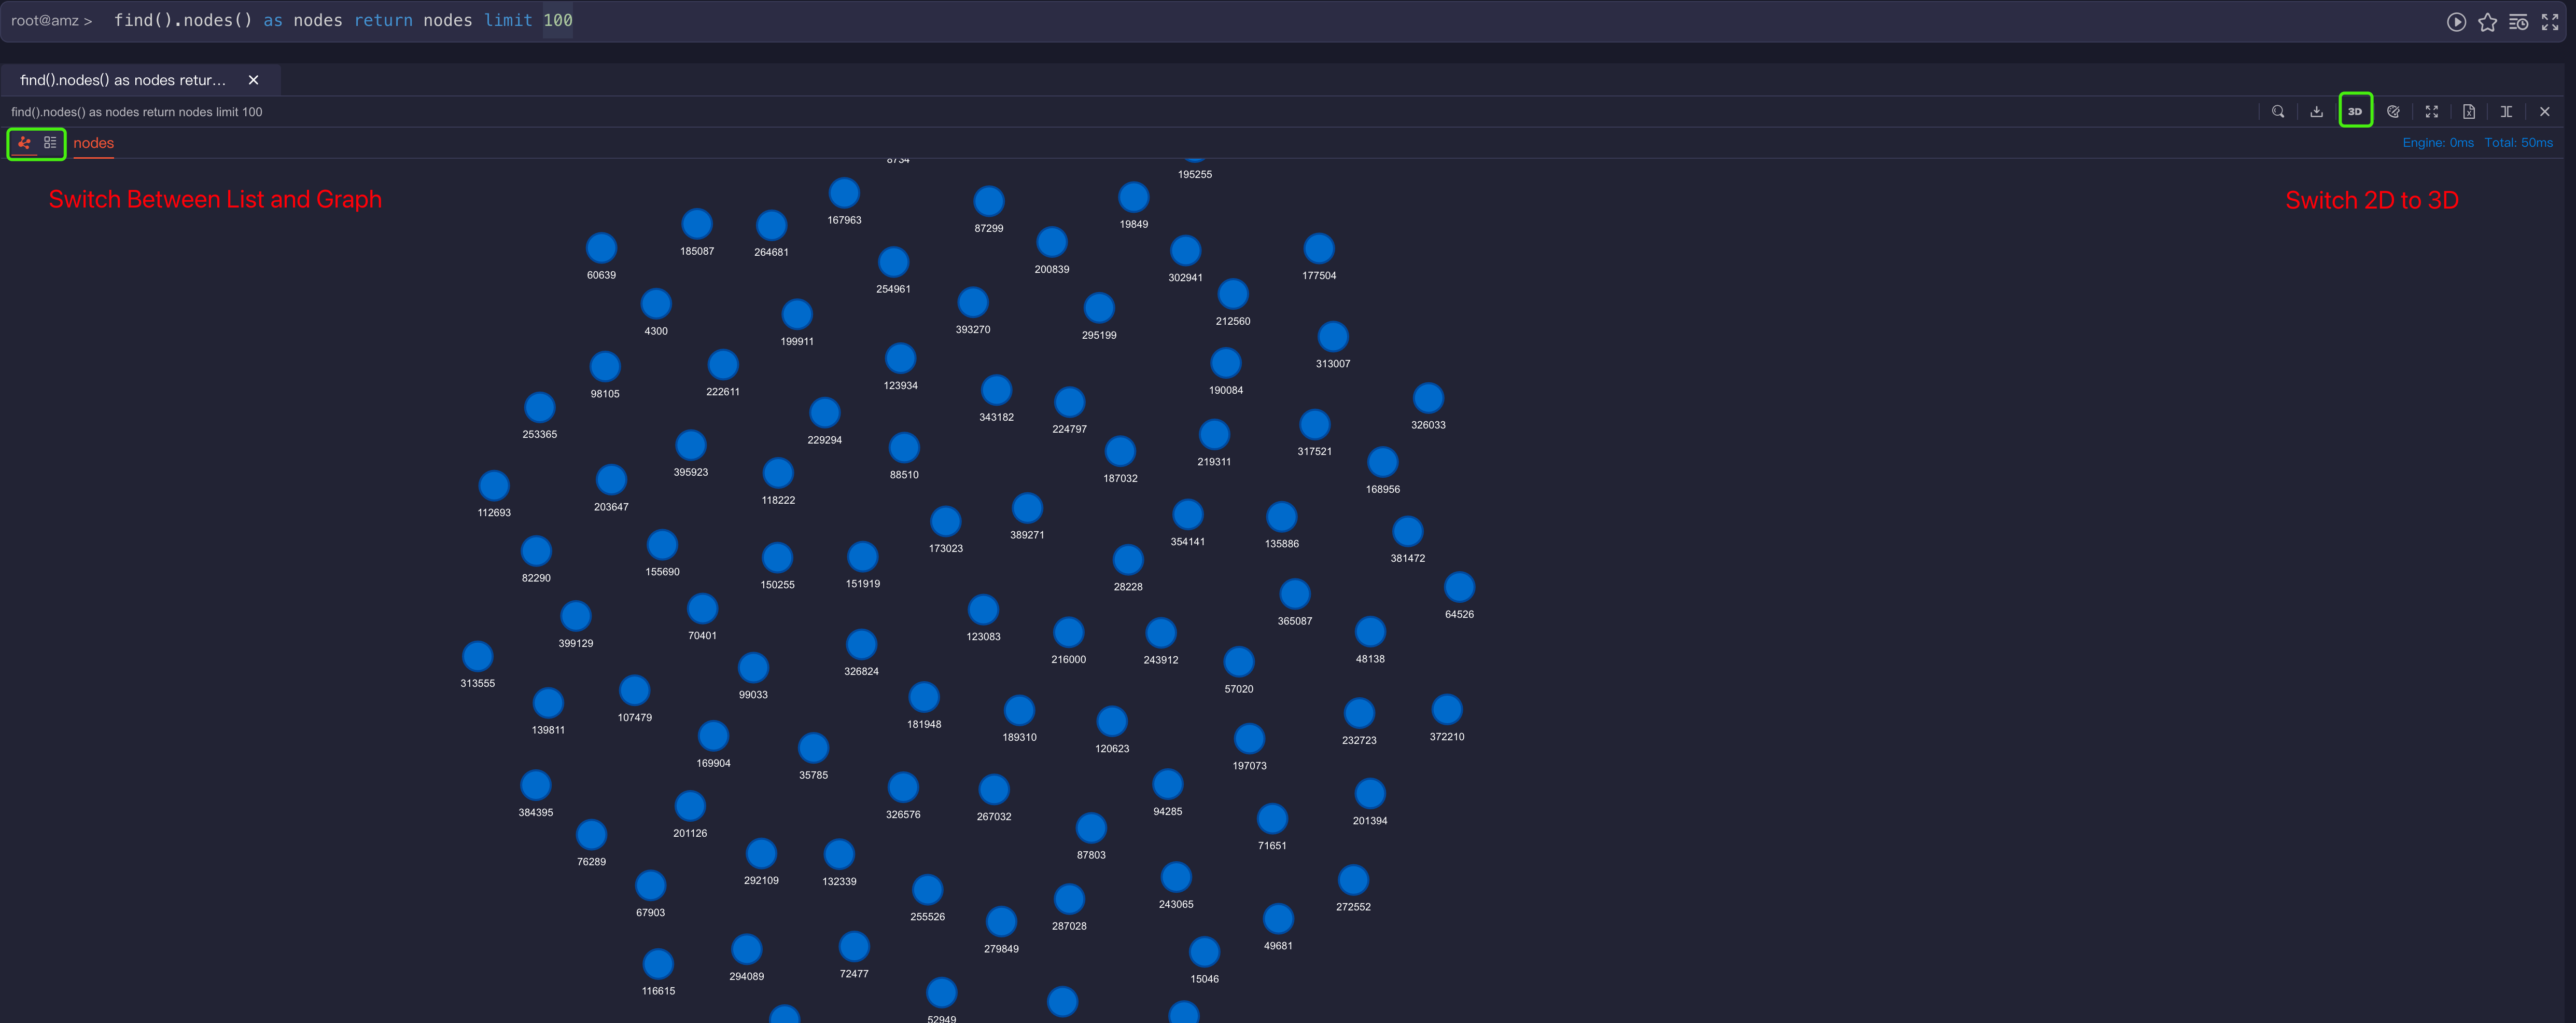
    The UQL statement you used finds and returns separate nodes, which didn’t carry relations with each other, you could click the 2D/3D icon to switch between the two modes easily. Not only 2D/3D visualization, you could add your own flavors to Ultipa Manager when viewing your query results by set icons, and colors for data to display.

    And you could see “fancier” results if you query a little bit more complex, like a path, as shown below (you could try run it in Ultipa Playground) then try to spread the results in tree or circle shapes. Graph is the best choice for high dimensional data, i.e., how data are complexly interleaved with each other, you could find that more and the more complex your query is, the better knowledge the graph returns to you. 

    n({@product}).le({@view}).n({@customer} as n1)
    .re({@has}).n({@card} as n2)
    .re({@transfer} as e1).n({@card}) as p
    return p{*}, n1{*}, n2{*}, e1{*}


    Ultipa Team

    Ultipa Admin 2022-12-13
    Add a comment...

    Discard
    Post

Your Answer

Post
Discard