p-Cohesion
HDC
Overview
The p-Cohesion algorithm identifies groups of network players (nodes) that are highly connected with each other, represented by cohesive subgraphs. It reveals the level of connectivity and interdependence within these groups, supporting in-depth analysis of graph structure and behavior.
The concept of p-cohesion was first proposed by S. Morris in a contagion model describing interactions within large populations:
- S. Morris, Contagion. The Review of Economic Studies, 67(1), 57–78 (2000)
Concepts
p-Cohesion
One natural measure of the 'cohesion' of a group is the relative frequency of ties among its members compared to non-members. Let cohesion be a constant p ∈ (0,1). A p-Cohesion is a connected subgraph in which every node has, at least, a proportion p of its neighbors within the subgraph. In other words, each node has at most, a proportion (1 − p) of its neighbors outside the subgraph.
The p-Cohesion model offers two key advantages over other cohesive subgraph models:
- With a high p value, p-Cohesion ensures both strong internal cohesiveness and sparse connections to outside nodes.
- It considers the proportion of neighbors within the group rather than a fixed number (such as the k value in k-Core), making it better suited for graphs with varying node degrees.
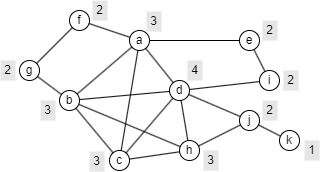
The example graph below illustrates this. Suppose p = 0.6. A grey label next to each node shows the minimum number of internal neighbors required for the node to remain in a p-Cohesion.
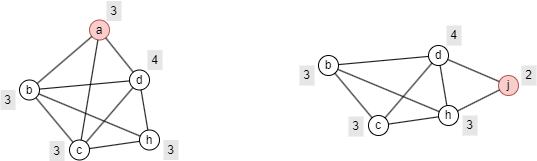
Below are the minimal p-Cohesion subgraphs, in terms of node count, that include node a and node j, respectively.
Ultipa's p-Cohesion algorithm returns an approximate minimal p-Cohesion subgraph for each query node, represented as a set of nodes.
Considerations
- The p-Cohesion algorithm treats all edges as undirected, ignoring their original direction.
Example Graph
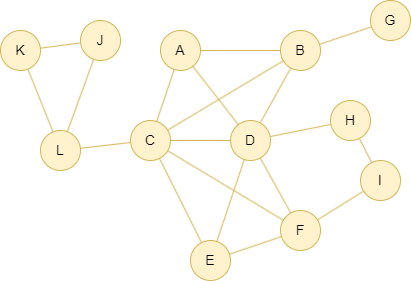
Run the following statements on an empty graph to define its structure and insert data:
INSERT (A:default {_id: "A"}), (B:default {_id: "B"}), (C:default {_id: "C"}), (D:default {_id: "D"}), (E:default {_id: "E"}), (F:default {_id: "F"}), (G:default {_id: "G"}), (H:default {_id: "H"}), (I:default {_id: "I"}), (J:default {_id: "J"}), (K:default {_id: "K"}), (L:default {_id: "L"}), (K)-[:default]->(J), (K)-[:default]->(L), (J)-[:default]->(L), (L)-[:default]->(C), (C)-[:default]->(A), (A)-[:default]->(B), (C)-[:default]->(B), (A)-[:default]->(D), (B)-[:default]->(G), (B)-[:default]->(D), (D)-[:default]->(C), (C)-[:default]->(E), (C)-[:default]->(F), (D)-[:default]->(E), (E)-[:default]->(F), (D)-[:default]->(F), (D)-[:default]->(H), (I)-[:default]->(H), (F)-[:default]->(I);
Creating HDC Graph
To load the entire graph to the HDC server hdc-server-1 as my_hdc_graph:
CREATE HDC GRAPH my_hdc_graph ON "hdc-server-1" OPTIONS { nodes: {"*": ["*"]}, edges: {"*": ["*"]}, direction: "undirected", load_id: true, update: "static" }
Parameters
Algorithm name: p_cohesion
Name | Type | Spec | Default | Optional | Description |
|---|---|---|---|---|---|
ids | []_id | / | / | Yes | Specifies each node by its _id to find the approximate minimal p-cohesions that include it. If unset, specifies all nodes. |
uuids | []_uuid | / | / | Yes | Specifies each node by its _uuid to find the approximate minimal p-cohesions that include it. If unset, specifies all nodes. |
p | Float | (0,1) | / | No | For each node in a p-cohesion, at least a proportion p of its neighbors are within the p-cohesion, and no more than a proportion (1−p) are outside it. |
return_id_uuid | String | uuid, id, both | uuid | Yes | Includes _uuid, _id, or both to represent nodes in the results. |
File Writeback
CALL algo.p_cohesion.write("my_hdc_graph", { ids: ["A","I"], p: 0.7, return_id_uuid: "id" }, { file: { filename: "cohesion" } })
Result:
File: cohesionsubgraph contains A: D,F,B,A,E,C,
subgraph contains I: I,D,F,H,B,A,E,C,
Stats Writeback
CALL algo.p_cohesion.write("my_hdc_graph", { ids: ["A","I"], p: 0.7, return_id_uuid: "id" }, { stats: {} })
Result:
| max size of subgraphs |
|---|
| 8 |
Stream Return
CALL algo.p_cohesion.stream("my_hdc_graph", { ids: ["A","I"], p: 0.7, return_id_uuid: "id" }) YIELD s RETURN s
Result:
| subgraph contains(id) | _ids |
|---|---|
| A | [D,F,B,A,E,C] |
| I | [D,F,H,B,A,E,C,I] |
Stats Return
CALL algo.p_cohesion.stats("my_hdc_graph", { ids: ["A","I"], p: 0.7 }) YIELD s RETURN s
Result:
| max size of subgraphs |
|---|
| 8 |