Graph
The Graph module provides an overview of the graphs, schemas of the currently selected graph, cluster, and database information.
Graphs
At the top of this module, it displays the name of the currently selected graphset. Click on this area to view all graphsets created in the database on the right side.
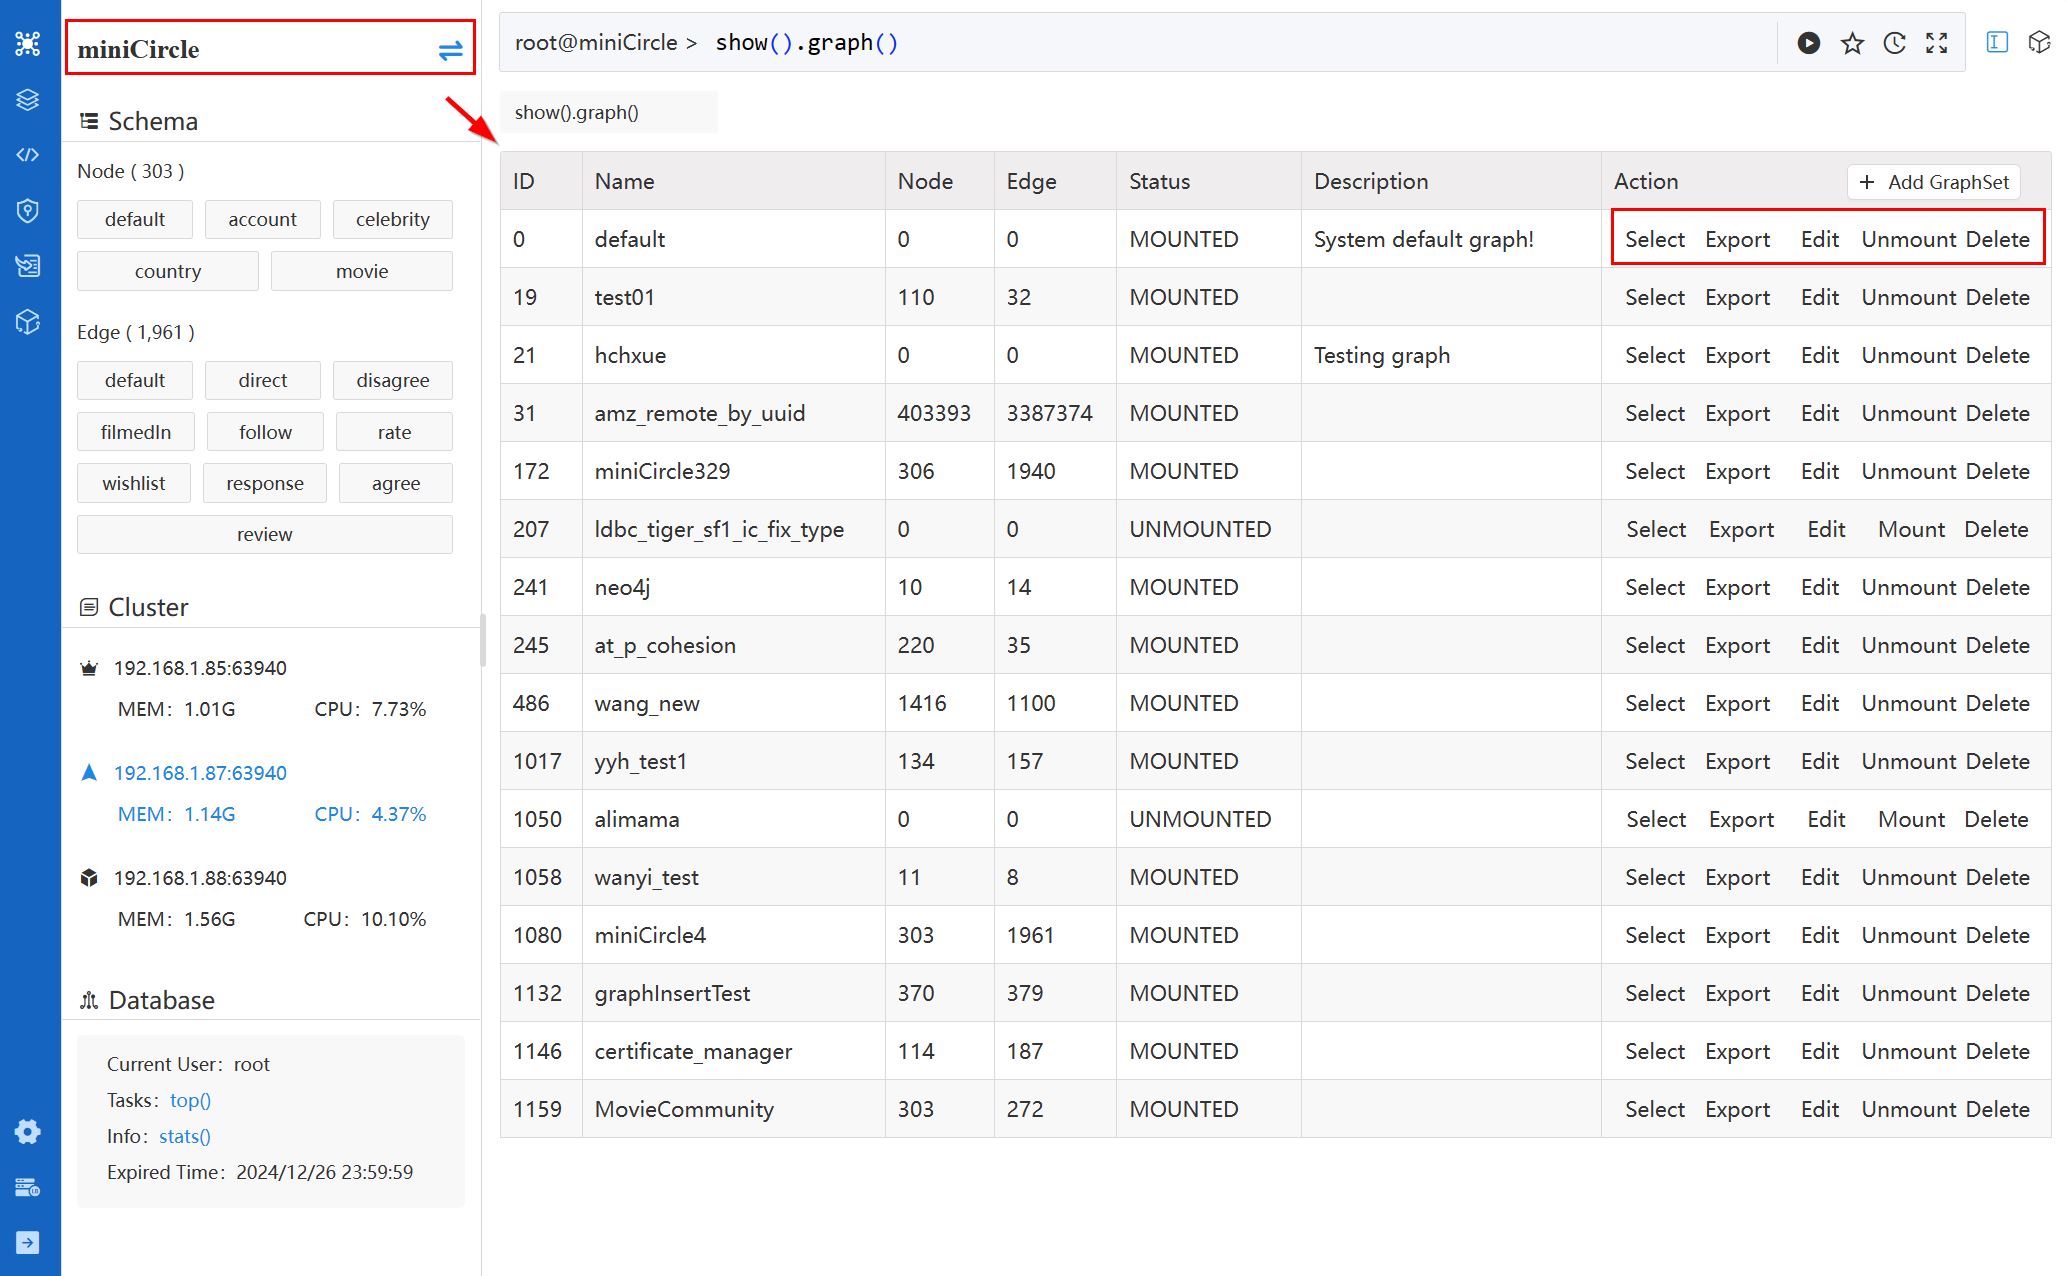
The list of all graphs showcases the ID, Name, number of Node, number of Edge, Status, and Description for each graph. The Action column offers the following operations:
- Select: Choose a different graphset as the current one. Only one graphset can be selected at a time for executing queries and algorithms.
- Export
- Export Structure: Export all the UQL commands to create the graph, schemas, properties, indices and full-text indices.
- Export Nodes: Export all or part of the nodes (in CSV) by specifying the schemas and properties.
- Export Edges: Export all or part of the edges (in CSV) by specifying the schemas and properties.
- Edit: Modify the name and description of the graphset.
- Mount/Unmount: Mount the graphset to the memory or unmount the graphset from the memory. Learn more about Mount/Unmount
- Delete
- Node: Delete all nodes but keep node schemas and properties.
- Edge: Delete all edges but keep edge schemas and properties.
- All data: Delete all nodes and edges but keep all schemas and properties.
- GraphSet and data: Delete the graphset along with all the contained data.
Click the Add GraphSet to create new graphset.
Schema
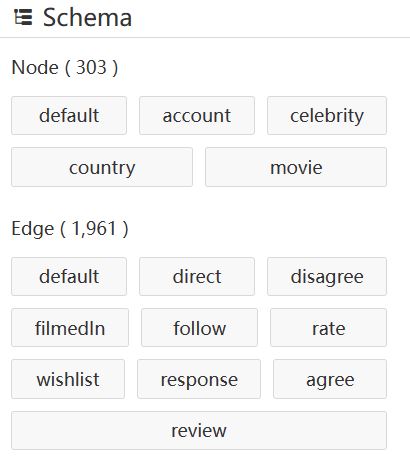
The Schema section presents all node and edge schemas of the currently selected graphset, along with the total count of nodes and edges.
Cluster
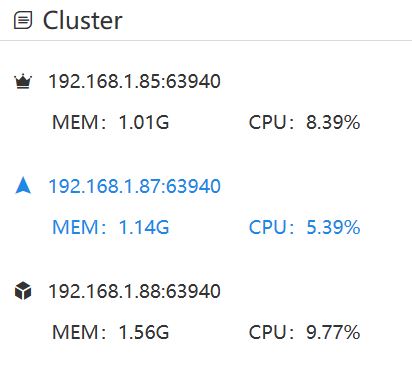
The Cluster section enumerates all server nodes in the cluster, indicating the IP address, and memory and CPU used by this instance. Hover over the icon in front each server to see its role (Leader, Follower, Algo).
The currently connected server is highlighted. In case any server is offline, it will be displayed in a grayed-out fashion.
Database
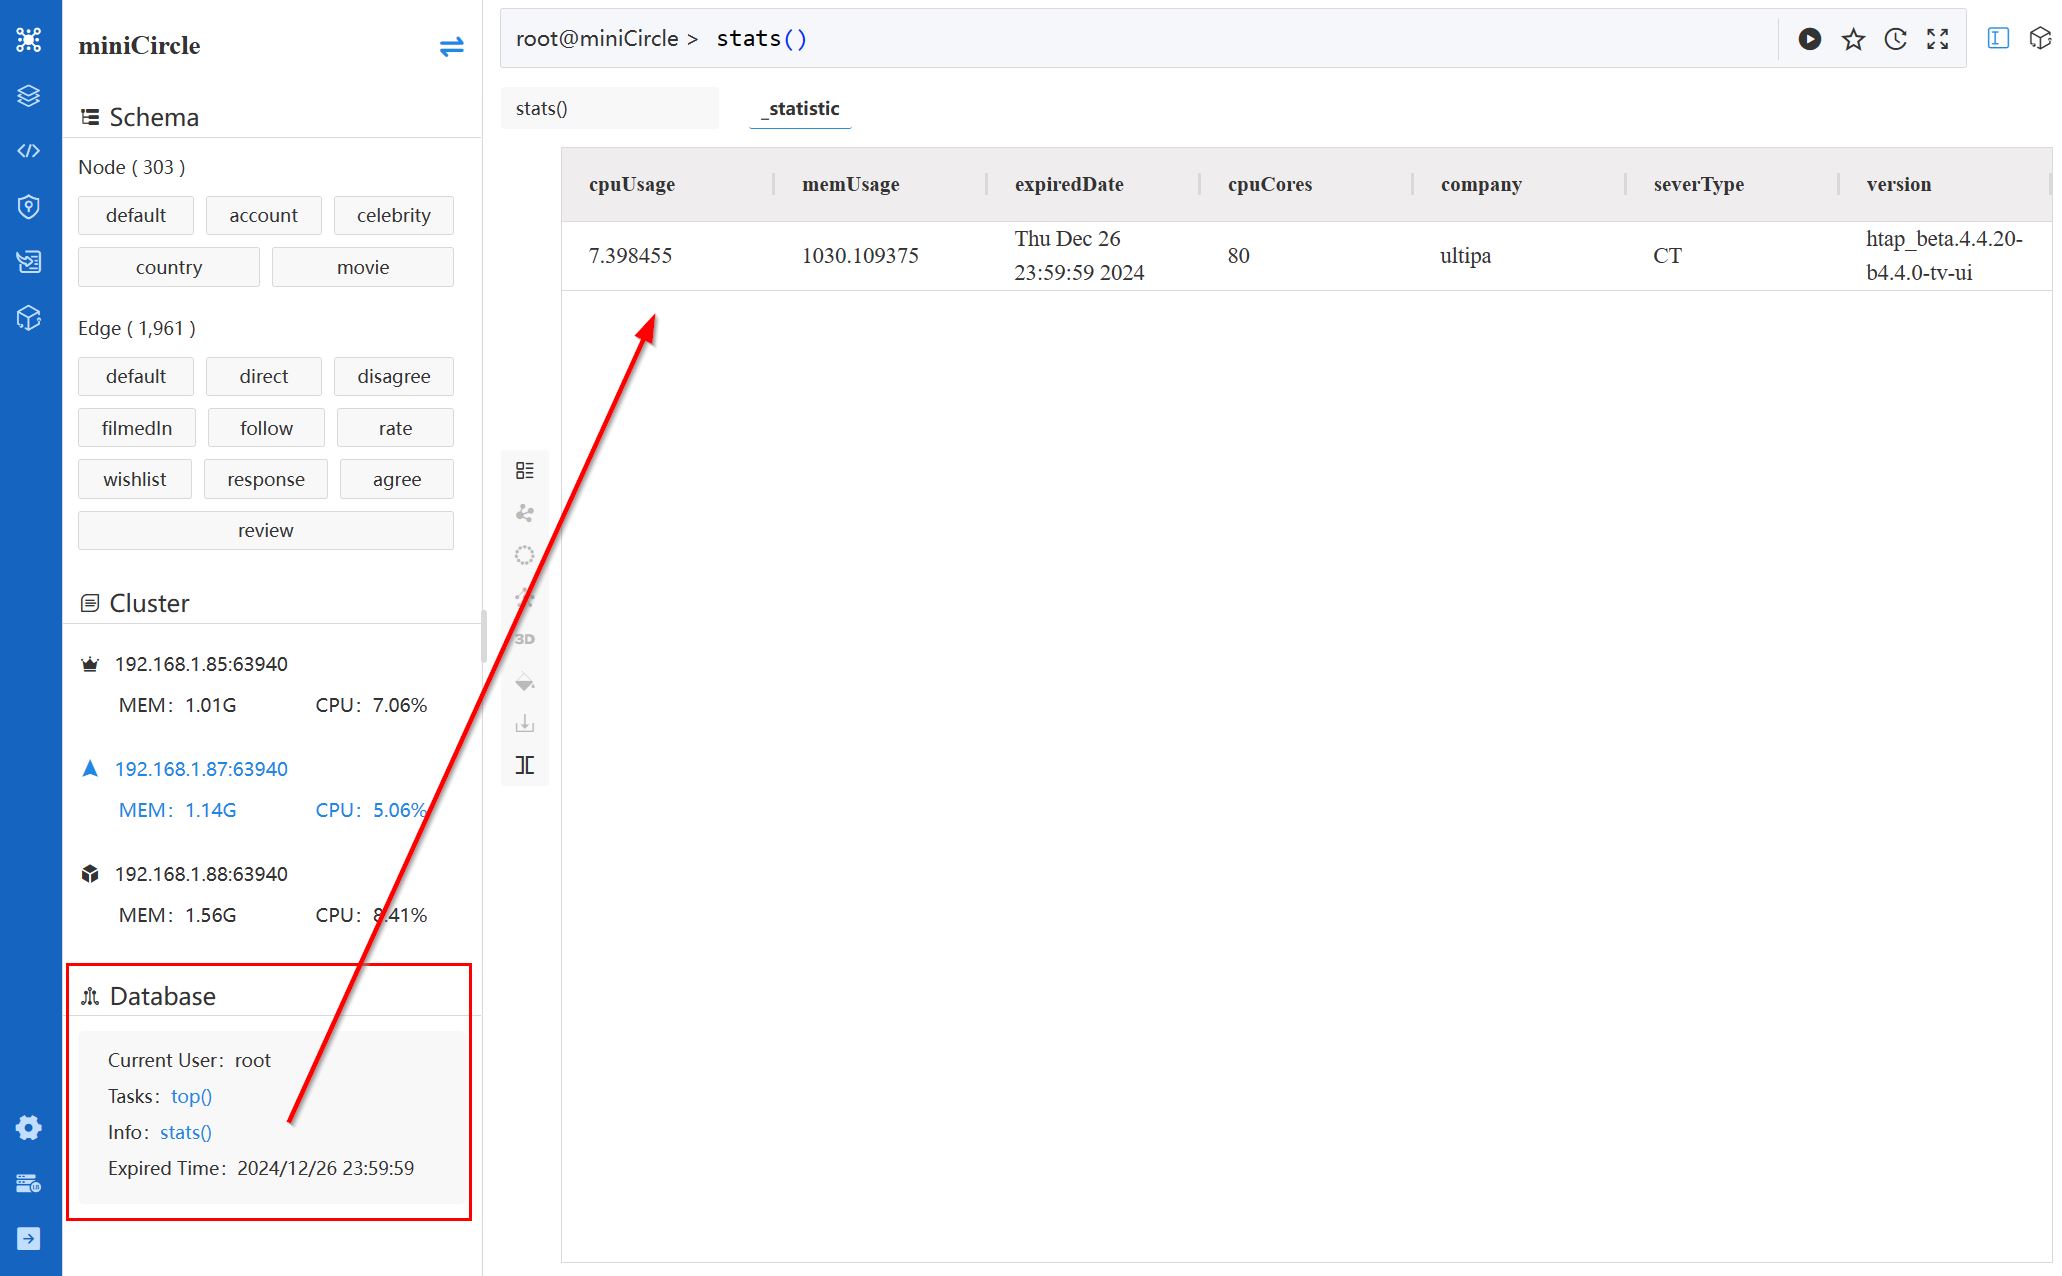
Information displayed in the Database section includes:
- Current User: Name of the currently logged-in database user.
- Tasks: Click the
top()command to view all ongoing processes. - Info: Click the
stats()command to view statistics of the database server. - Expired Time: The expiration time of the Ultipa Server license.