Monitor
This manual introduces the minimum procedure of using Ultipa Monitor in conjuction with Prometheus to monitor Ultipa Server status.
Prerequisite
- Ultipa Server V4.0 or higher installed and started
- Latest version of Prometheus installed and started
File Preparation
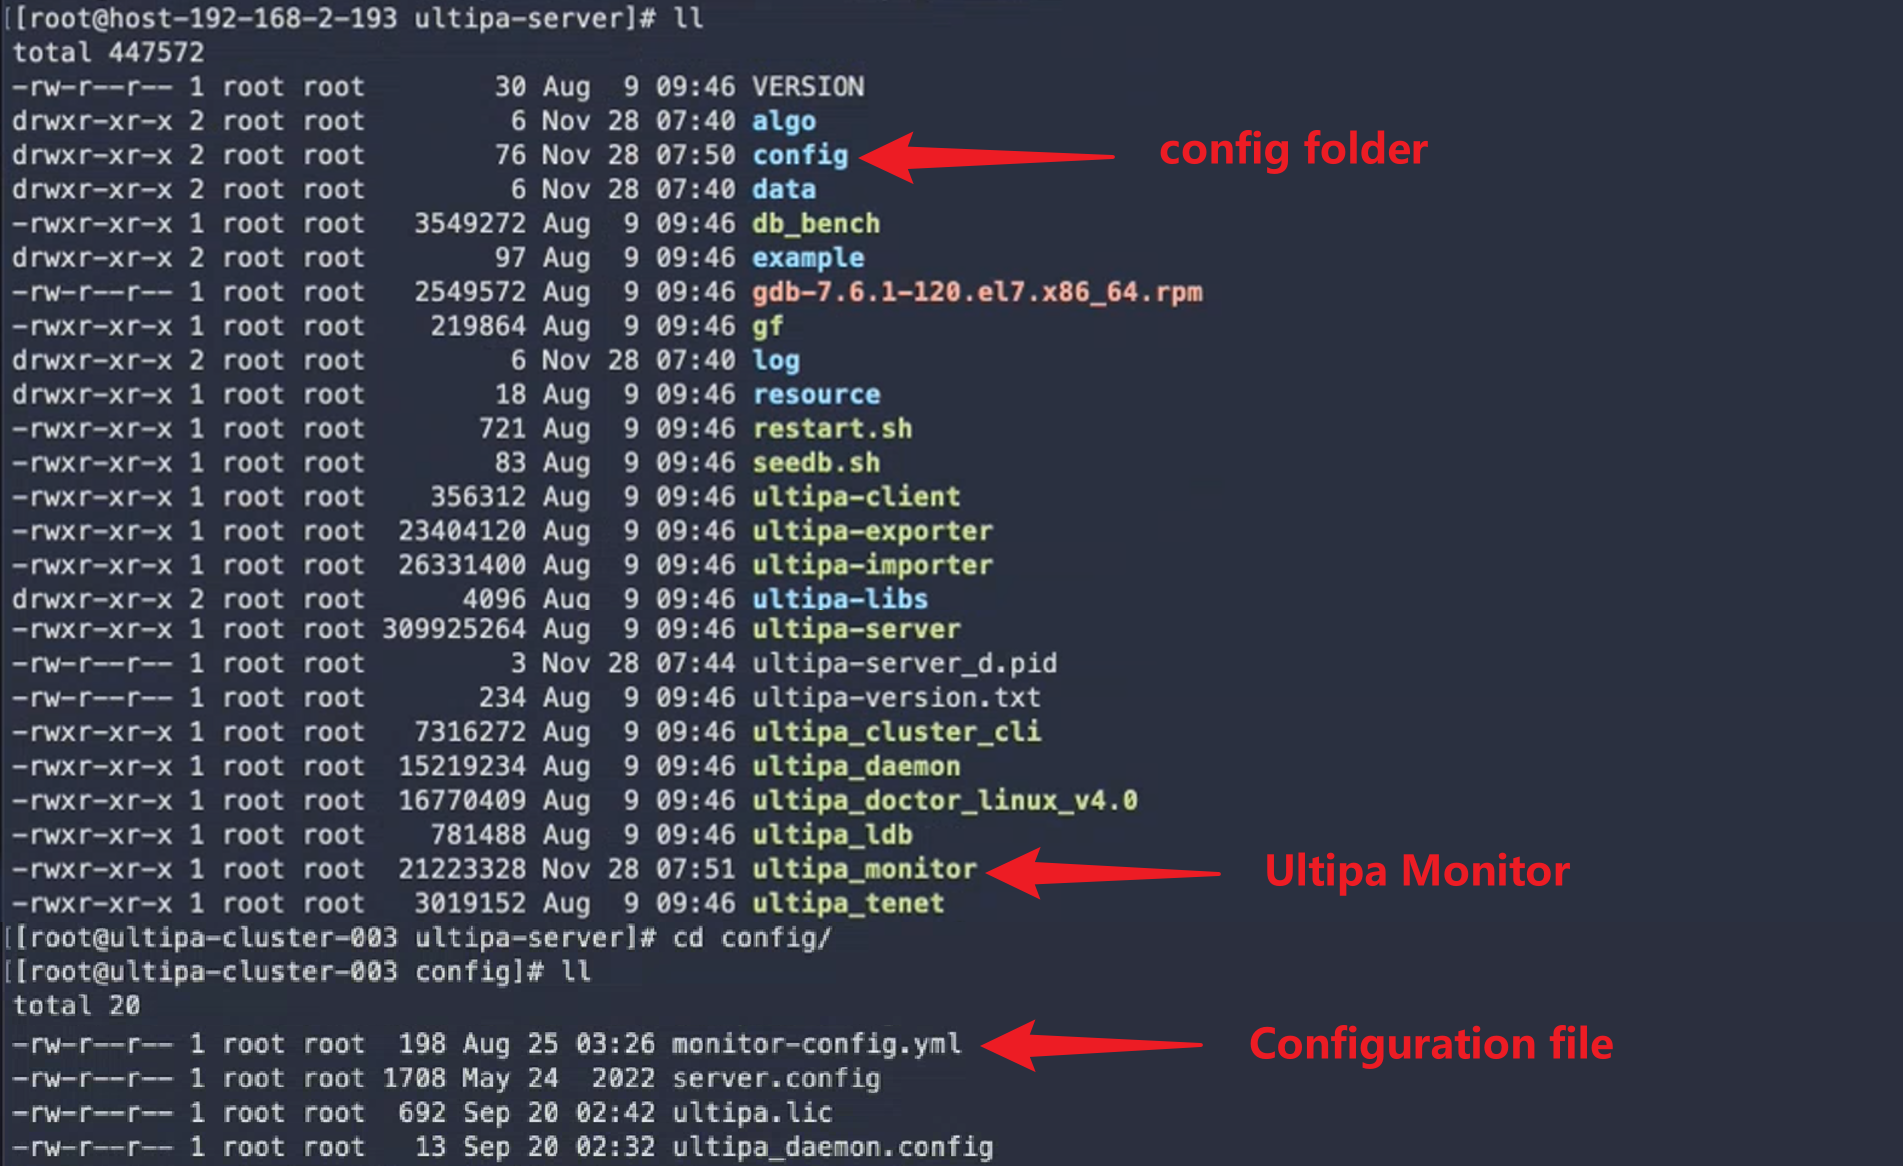
1. Files of Ultipa Monitor (ultipa_monitor) and its configuraiton (./config/monitor-config.yml) are contained in the direcotry of Ultipa Server by default. In case they are not found, please contact our support team.
2. Modify the configuration file if necessary. Below is a sample of the file with definiation of each parameter:
YAML# the first part of content usually needs no modification
configfile:
  # file name of server config
  name: server.config
  # file path of server config
  path: ./config/
  # file type of server config
  type: ini
  # file path to record server process id
  pidfile: ./ultipa-server_d.pid

# modify the second part of content based on the real situation
monitor:
  # file path of monitor log
  logpath: "./mlog"
  # port of monitor
  port: 19988

# modify the third part of content based on the real situation
prometheus:
  # the name of job to be called by Prometheus
  fqname: "ultipa_server_info"
  # whether allows Prometheus to call the job
  status: true
3. In case the file of Ultipa Monitor is not executable (usually occurs after manually copying Ultipa Monitor to the server directory), run chmod +x <filename> to grant execution permission. Below is the sample command:
Bashchmod +x ultipa_monitor
Start Ultipa Monitor
1. Install libpcap in case the feature of capturing and filtering packets is not enabled:
Bashyum -y install libpcap-devel
2. Run below command to start Ultipa Monitor when it is stopped, or restart Ultipa Monitor if its configuration file is modified:
Bash./ultipa_monitor -d
Configure Prometheus
1. Add the job information of Ultipa Monitor to the YML configuration file of Prometheus (prometheus). It can be attached to those existing jobs:
YAMLglobal:
  scrape_interval: 5s
  evaluation_interval: 60s
scrape_configs:
  - job_name: ultipa_server_info-1
    static_configs:
      - targets: ['192.168.2.195:19989']
        labels:
          instance: ultipa_server_infor-1
  - job_name: ultipa_server_info-2
    static_configs:
      - targets: ['192.168.2.47:19989']
        labels:
          instance: ultipa_server_infor-2
  - job_name: ultipa_server_info-3
    static_configs:
      - targets: ['192.168.2.51:19989']
        labels:
          instance: ultipa_server_infor-3
  # the 'fqname' defined in the config file of Ultipa Monitor
  - job_name: ultipa_server_info
    static_configs:
      # the server ip and monitor port defined in the config file of Ultipa Monitor
      - targets: ['192.168.1.87:19988']
        labels:
          instance: ultipa_server_info
2. Restart Prometheus:
Bashdocker restart prometheus
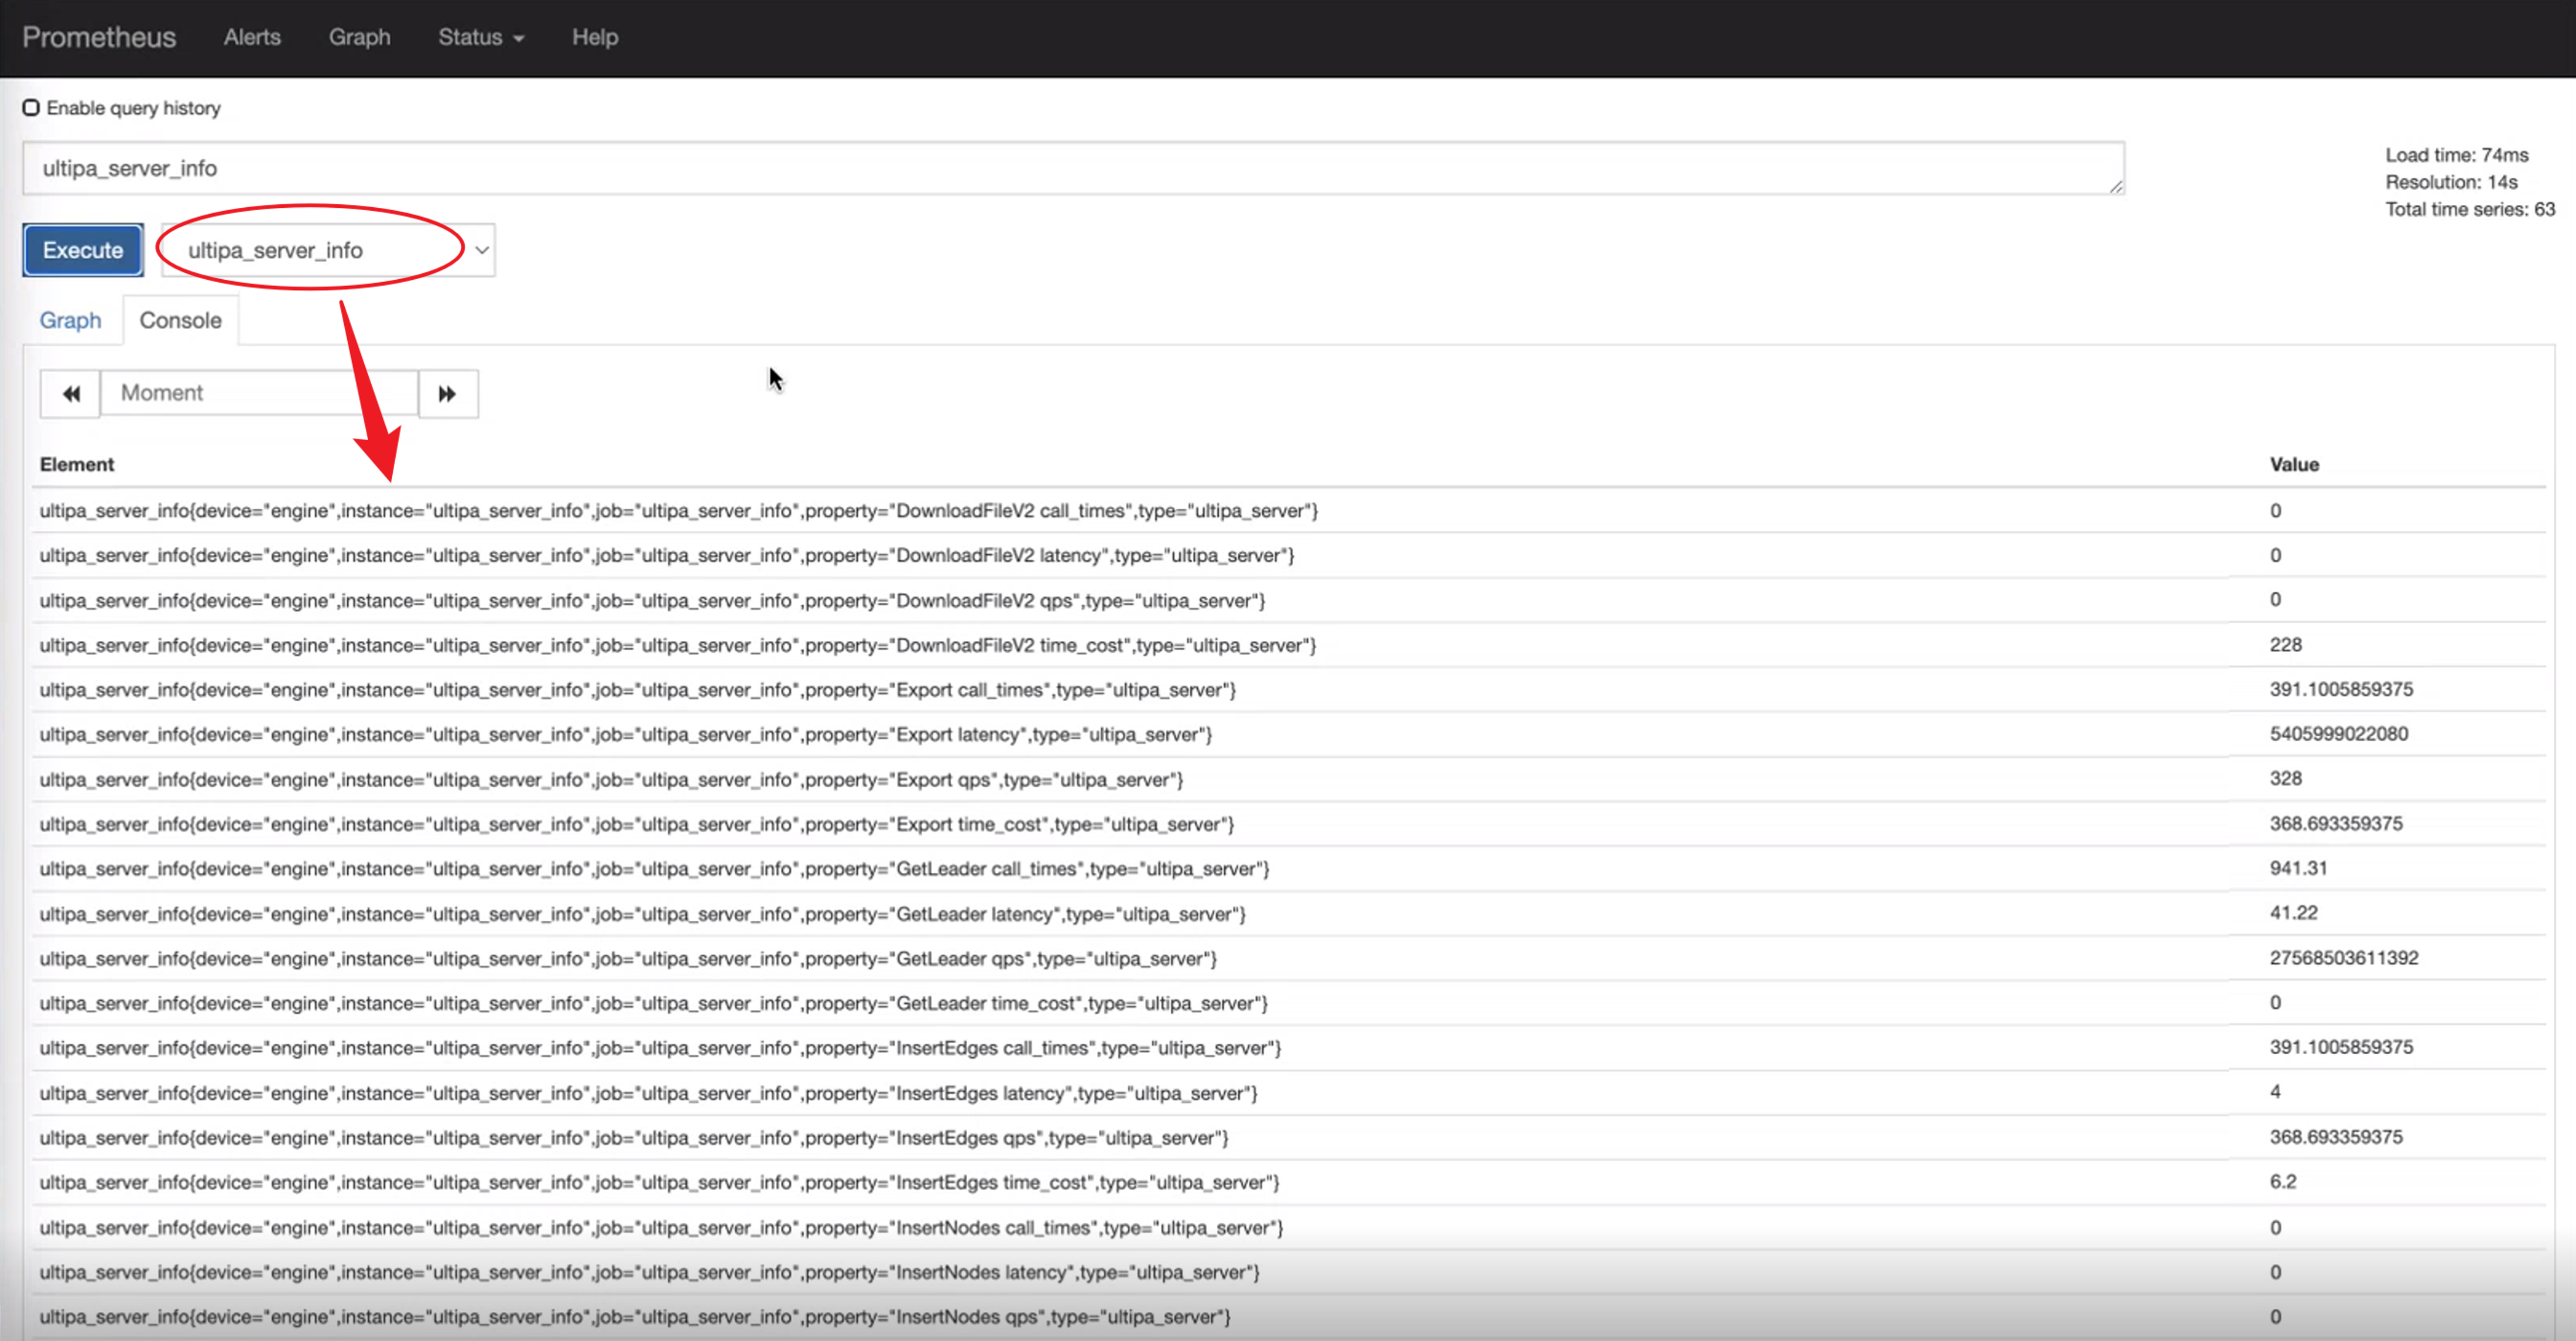
3. Switch to the newly added job in Prometheus user interface to confirm the connection:
NOTEIf other platforms are wanted, such as Grafana, they have to get metrics from Prometheus.