
2. Load Your Data
In the previous chapter you already ran a simple GQL query through Ultipa Manager. Run the GQL statements in this and all following chapters the same way.
A GQLDB instance can host many graphs (the free, unlicensed edition allows up to 2). The built-in default graph is ready to use right away, we will just use it to build this graph:

The INSERT Statement
For a handful of nodes and edges, write them directly with INSERT. The following GQL adds 7 users and the 10 follow relationships between them in a single statement:
GQLINSERT (alice:User {_id: "u1", name: "Alice", age: 30, city: "London"}),
       (bob:User {_id: "u2", name: "Bob", age: 25, city: "Berlin"}),
       (charlie:User {_id: "u3", name: "Charlie", age: 35, city: "Paris"}),
       (diana:User {_id: "u4", name: "Diana", age: 28, city: "London"}),
       (erik:User {_id: "u5", name: "Erik", age: 42, city: "Berlin"}),
       (fiona:User {_id: "u6", name: "Fiona", age: 31, city: "Paris"}),
       (george:User {_id: "u7", name: "George", age: 26, city: "London"}),
       (alice)-[:Follows {since: 2020}]->(bob),
       (bob)-[:Follows {since: 2021}]->(charlie),
       (charlie)-[:Follows {since: 2022}]->(alice),
       (diana)-[:Follows {since: 2021}]->(alice),
       (erik)-[:Follows {since: 2020}]->(alice),
       (fiona)-[:Follows {since: 2023}]->(alice),
       (bob)-[:Follows {since: 2021}]->(diana),
       (george)-[:Follows {since: 2022}]->(diana),
       (fiona)-[:Follows {since: 2022}]->(charlie),
       (george)-[:Follows {since: 2023}]->(alice)
Verify the number of users in the graph:
GQLMATCH (u:User) RETURN count(u)
You should get 7.
Bulk Import
For large datasets or data that lives in files (CSV, JSON) or another system (relational databases, Neo4j, Kafka, BigQuery, RDF), you have the following options:
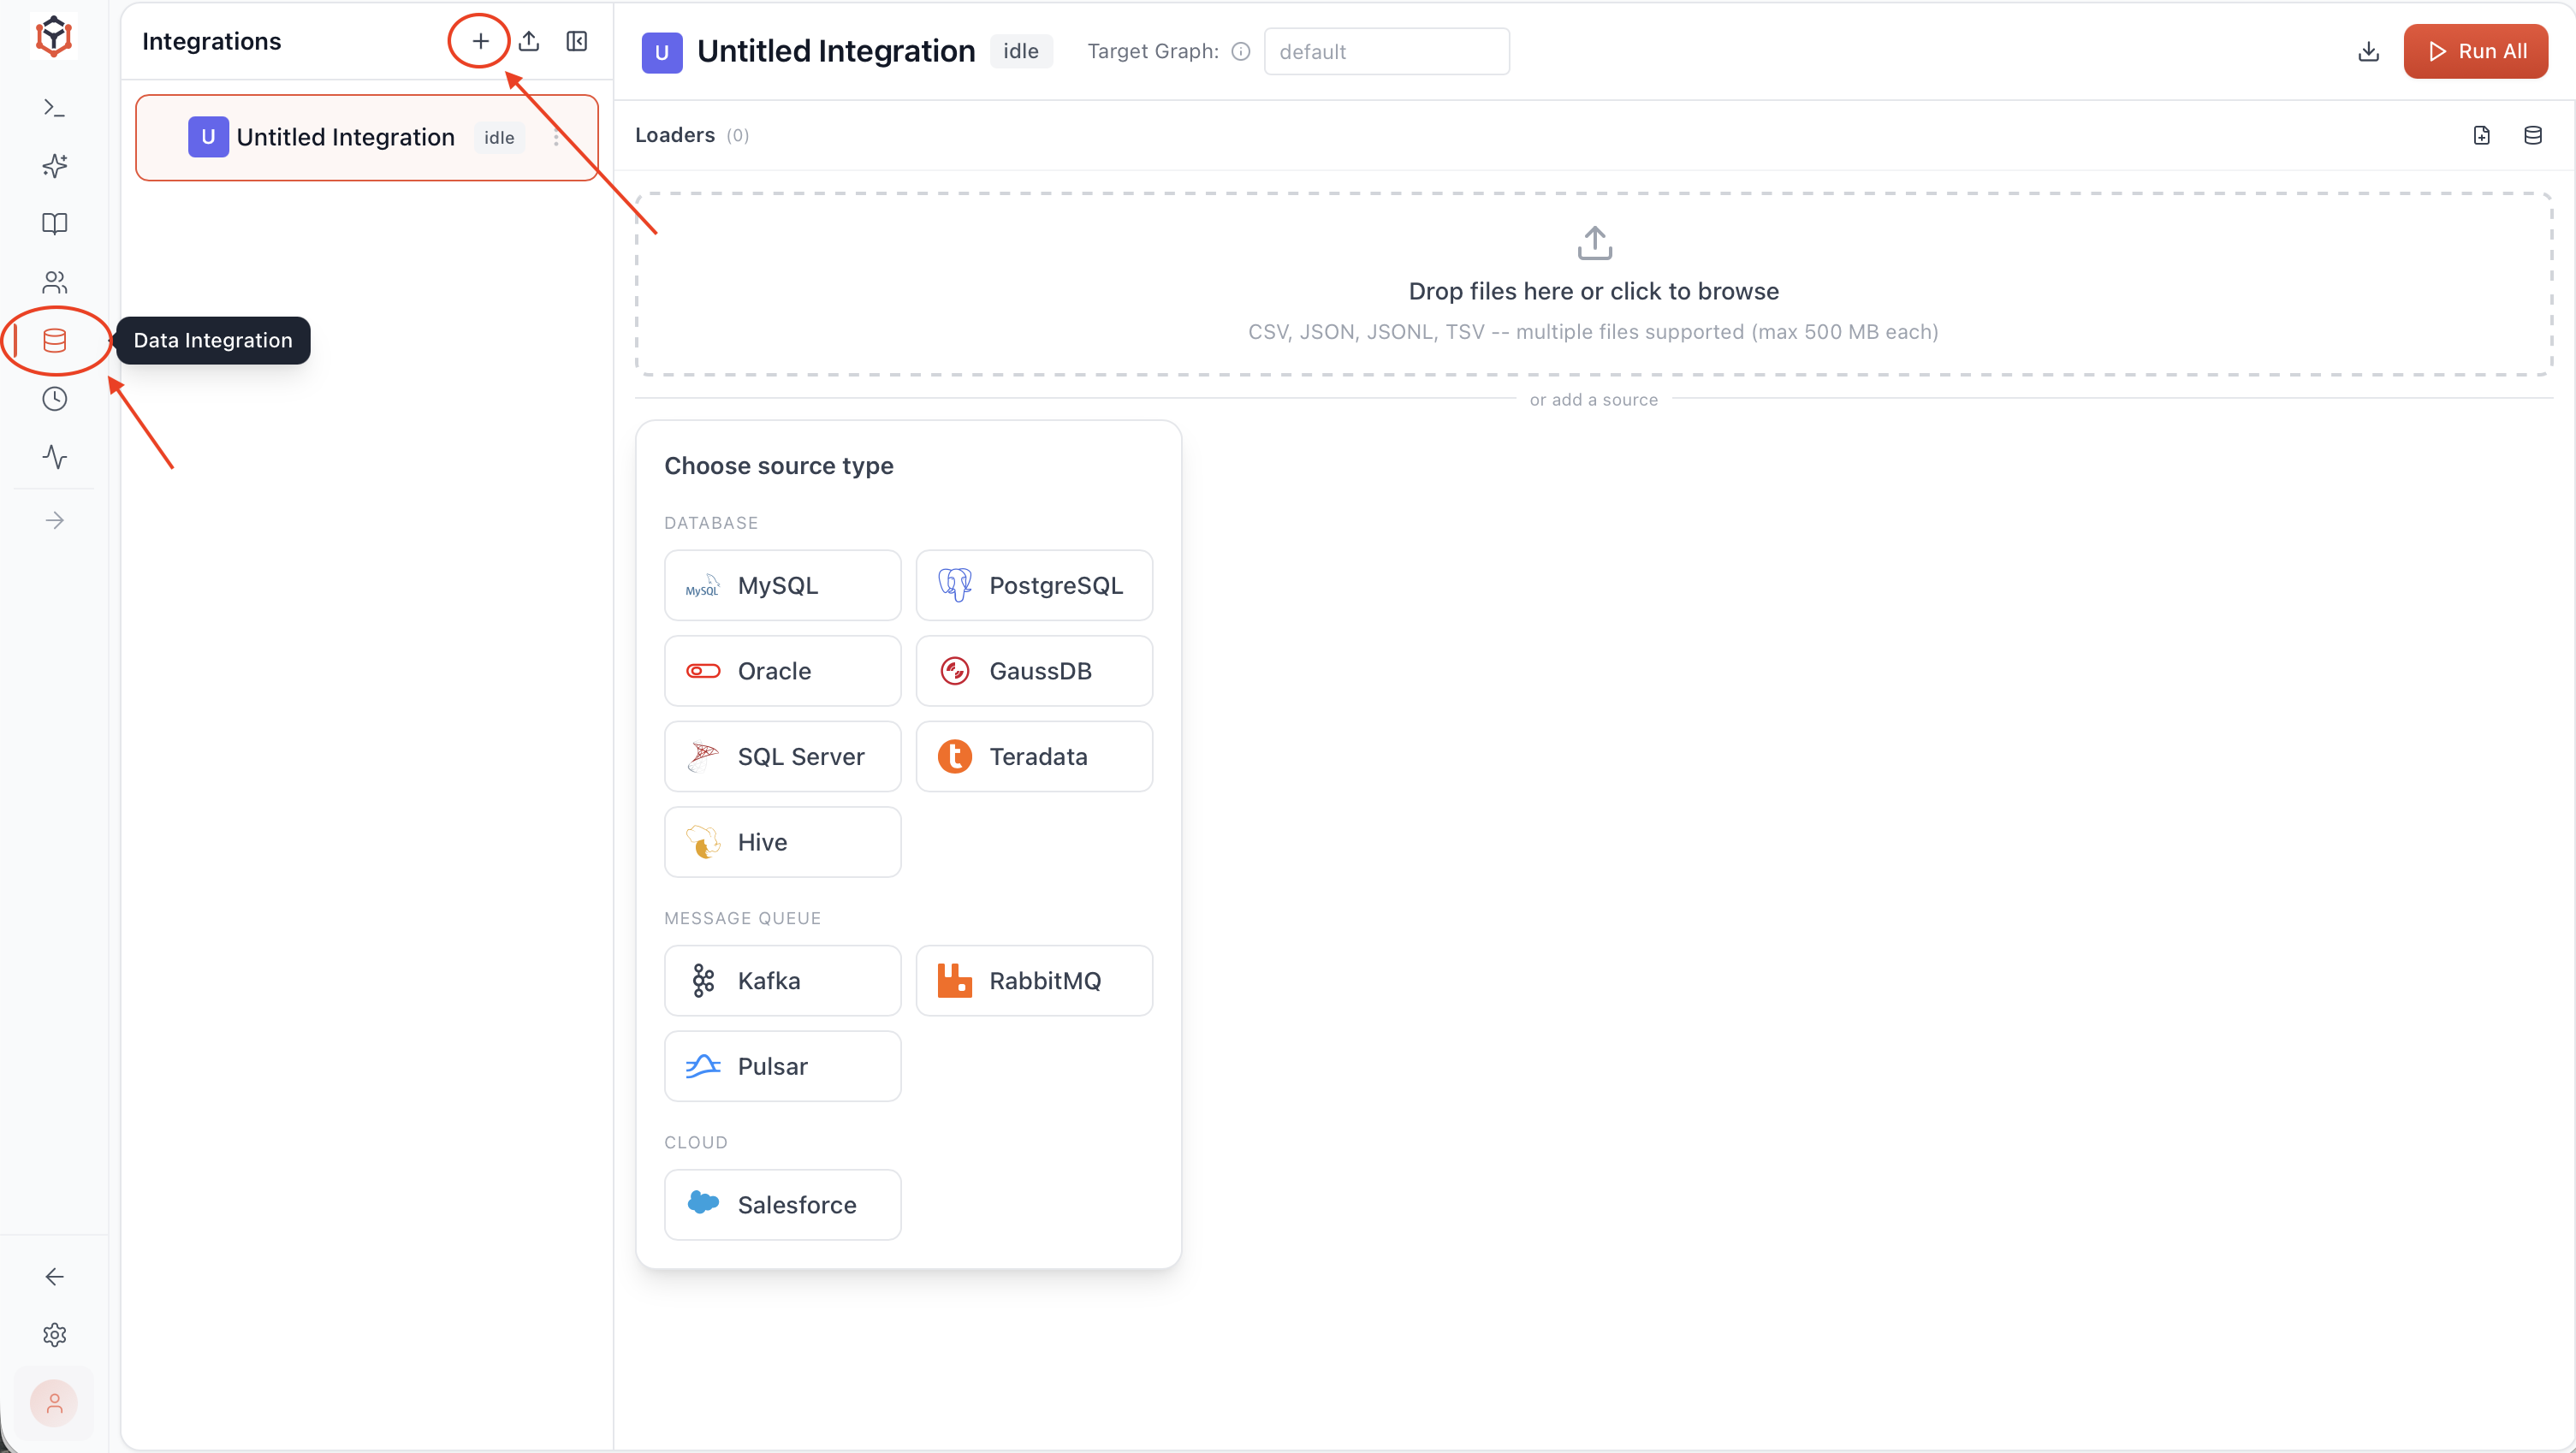
- Data Integration in Ultipa Manager
- Ultipa Transporter tool. Learn more
Your graph now has data. Time to ask it questions: Query Your Data.