Overview
G.V() is an all-in-one graph database client to write, debug, test and analyze results for your property-graph database. It offers a rich UI with smart autocomplete, graph visualization, editing and connection management. It's compatible with Ultipa and many more.
You can download G.V() from here.
References
Set up Connection
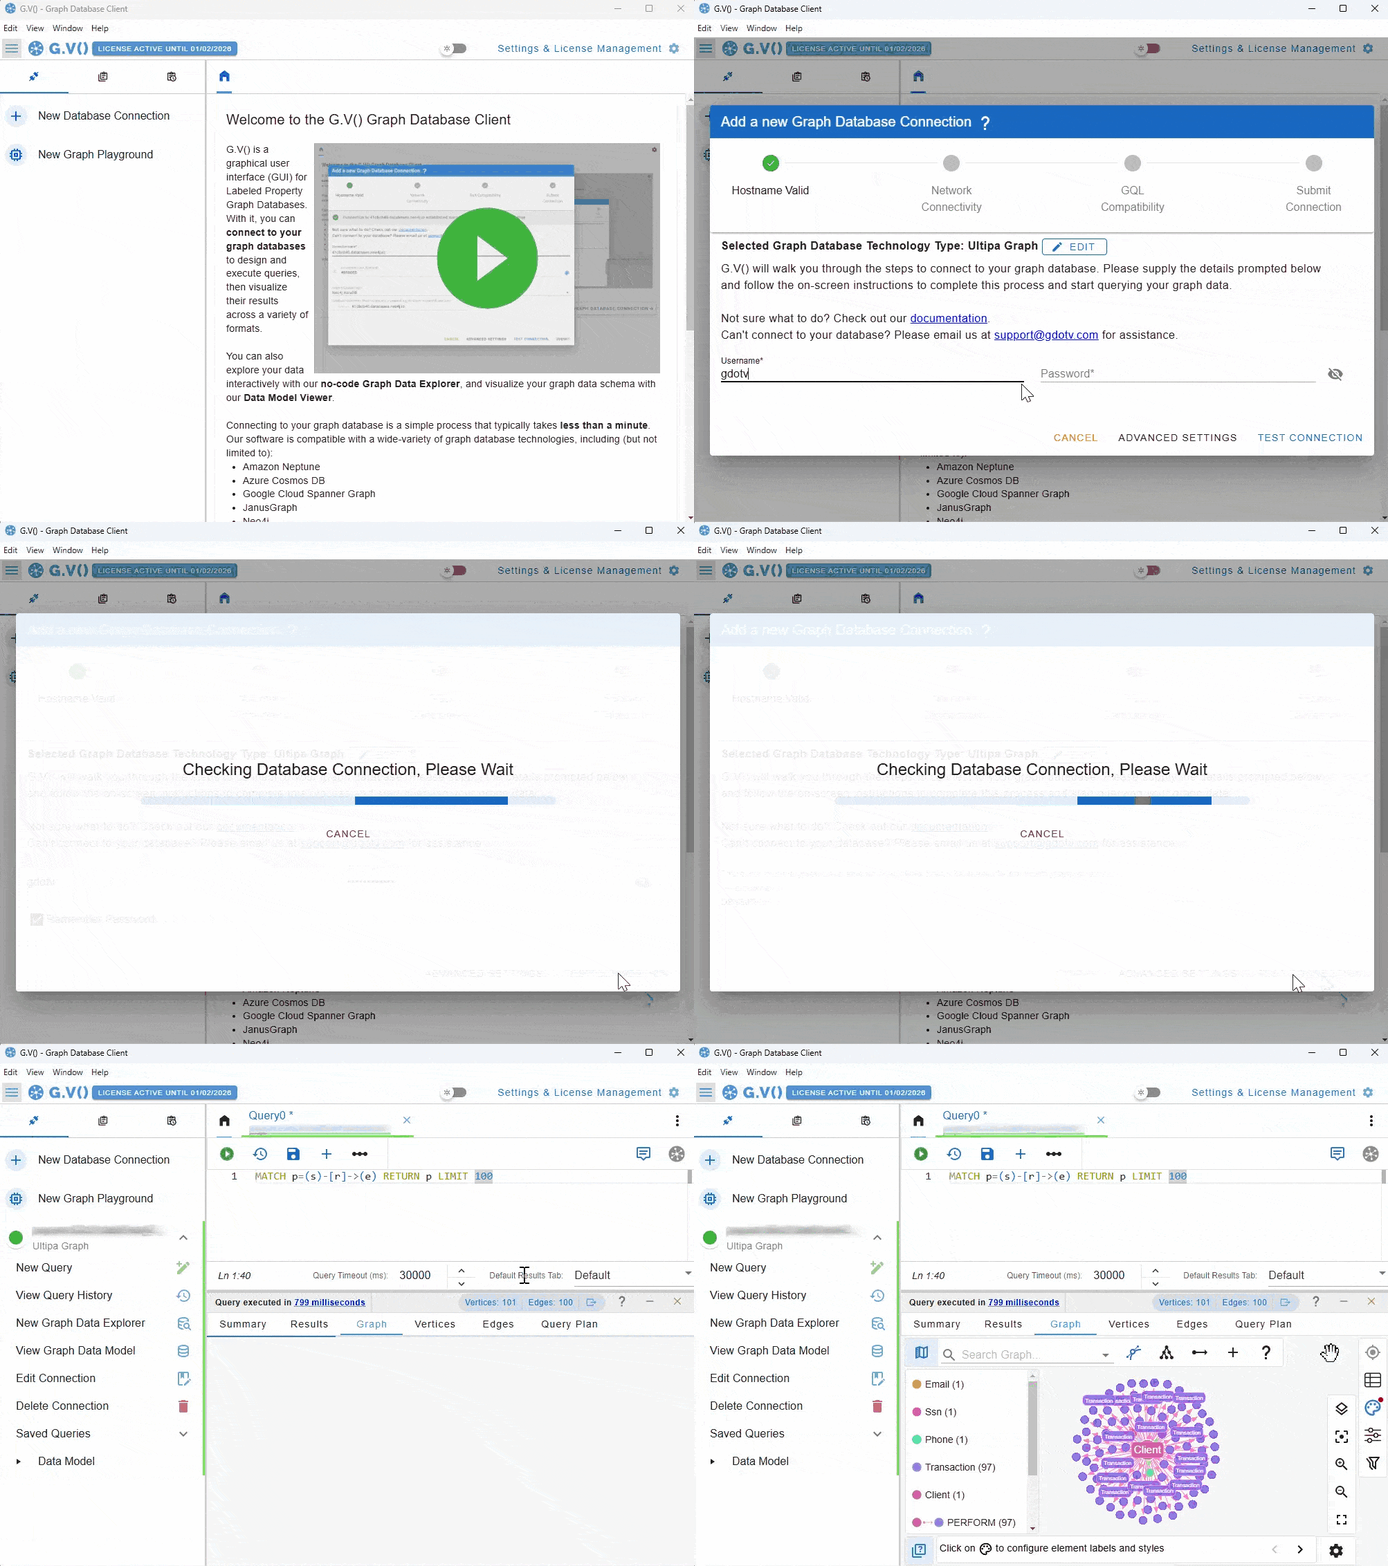
To connect to your Ultipa Graph, all you need is the hostname, login credentials, and to select your graph name. You can see how quick it is:

Graph Visualization from GQL Queries
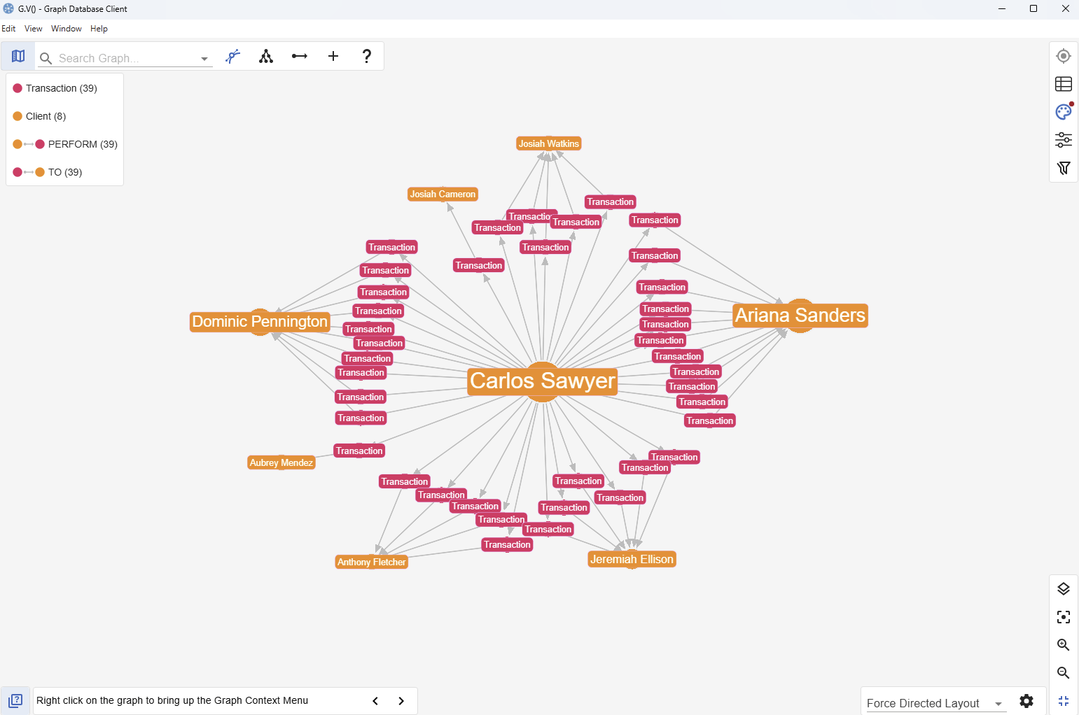
You can run your GQL queries through our own Query Manager within G.V(). For example, you can try running the following query in G.V() to see the Transaction nodes between the Client Carlos Sawyer and other Client nodes:
MATCH p = (s:Client {NAME: "Carlos Sawyer"})-[]->(e:Transaction)-[]->(c:Client)
RETURN p LIMIT 1000

Data Model Visualization
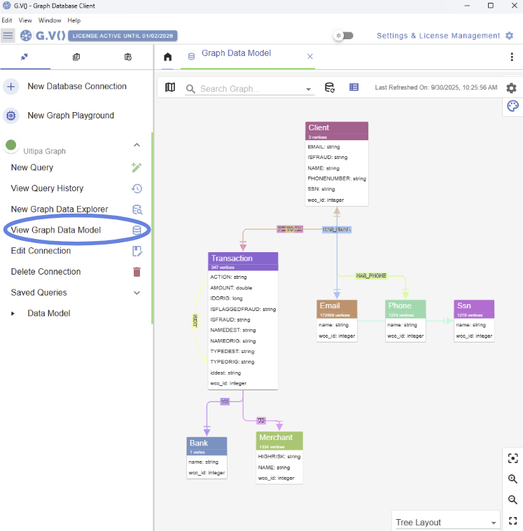
G.V() extracts the schema directly from your Ultipa Graph to create the Graph Data Model:

No-code Data Exploration
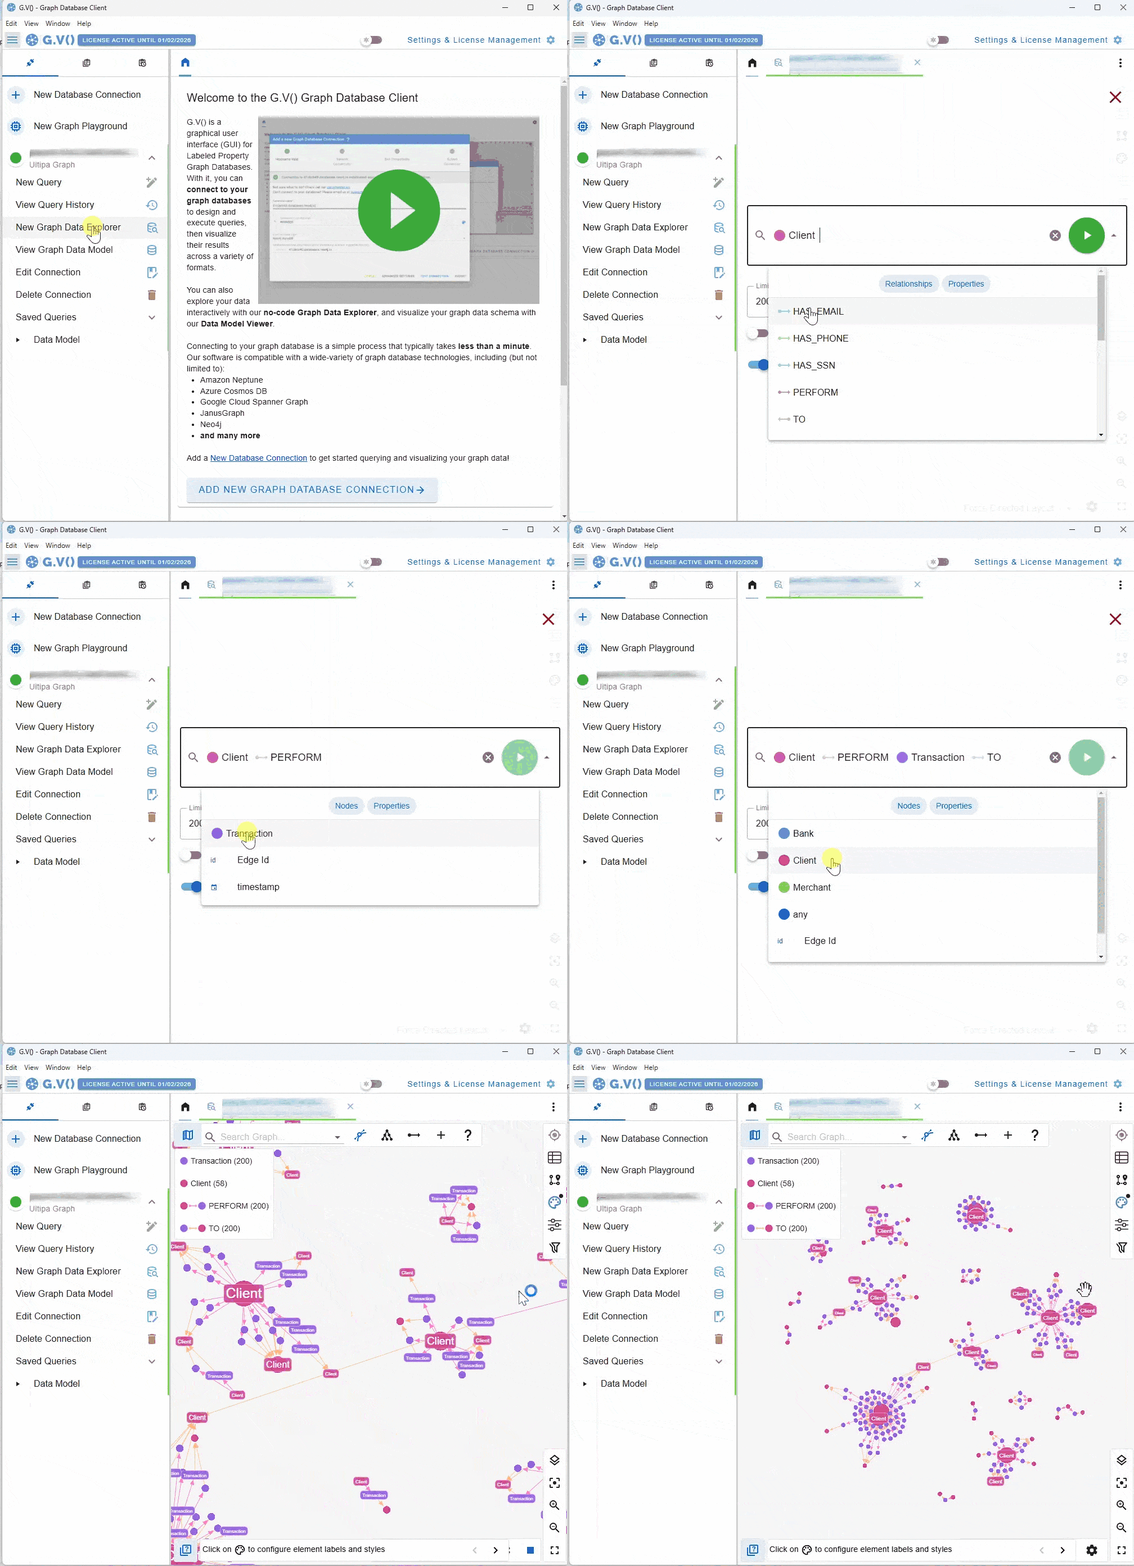
If you’re just wanting to do a quick exploration of your data and you’d like to take an easier route than writing GQL queries – you can use G.V()’s Data Explorer to explore your graph data without writing any code at all.
Just select the nodes and relationships you want from drop down menus. You can even add filters at the same time – no manual querying required.


